

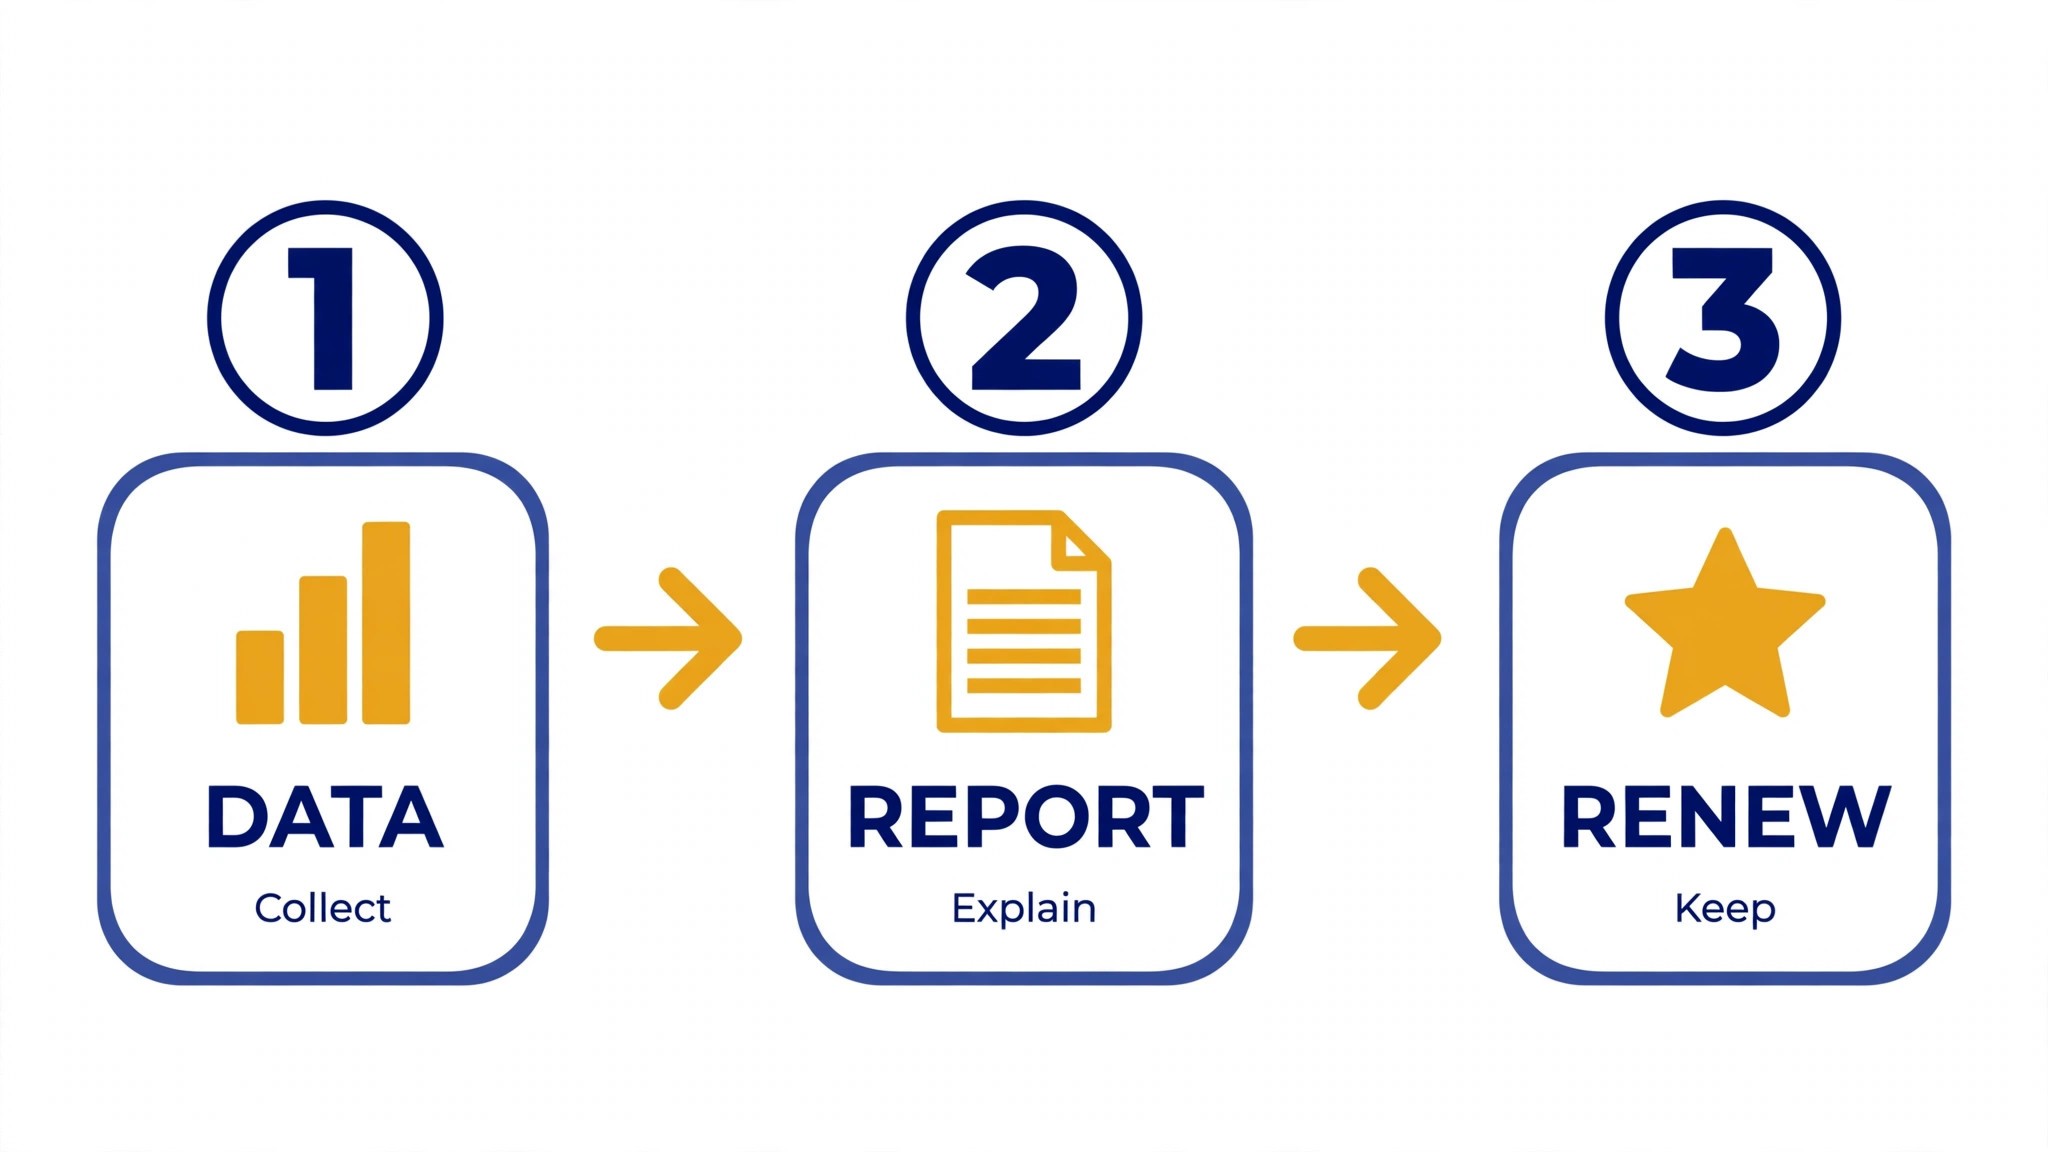
A client who cannot see what the budget bought will not renew, and most agencies discover that gap only when the renewal call goes quiet. The top 10 ai tools for campaign reporting close that gap by turning scattered ad, email and social numbers into a report a client can read in five minutes.
The difference between a report that keeps a client and one that loses one is rarely the data. It is whether the numbers answer the question the client actually asked, and whether the story matches the spend. A good reporting tool pulls the numbers itself, so the account manager spends the hour on the story instead of the spreadsheet.
This guide compares ten tools on published prices, the reporting job each one does best and the catch that only shows up after the trial ends. Each price below reflects the vendor’s published starting rate as of late 2026, or is marked pricing on request where the vendor discloses no rate. Start with the shortlist, then read the reviews that match the reports you send most.
The Full Shortlist in One Place
Use it to narrow the top 10 ai tools for campaign reporting to two or three candidates before you read the full reviews. Monthly list prices apply unless noted, and annual billing usually beats monthly billing for agencies who send reports every month.
| Job | Best tool | Why it wins |
|---|---|---|
| Small agencies with client reports | AgencyAnalytics | Client reports with a portal |
| Dashboards that clients can open anytime | Databox | Live dashboards for clients |
| Agencies with many clients to report on | Whatagraph | Beautiful reports at scale |
| Teams with zero reporting budget | Looker Studio | Free dashboards from Google |
| Moving data into Sheets and dashboards | Supermetrics | Data pipes for reporting |
| Agencies that want simple scheduled reports | Swydo | Simple reports that send themselves |
| Freelancers with a handful of clients | DashThis | Quick reports for small client lists |
| Agencies that also invoice clients | ReportGarden | Reports, invoices and budgets together |
| Large agencies with many data sources | TapClicks | Enterprise reporting at scale |
| Looker Studio users who need more connectors | Porter Metrics | Cheap connectors for Looker Studio |
How We Chose the Top 10 Ai Tools For Campaign Reporting
A tool earned a place here only when it builds a report a client will actually read in 2026, not when it added an AI label to an old dashboard. The top 10 ai tools for campaign reporting were judged on five things that decide whether an agency keeps paying after the first quarter.
We ranked the tools first on the reporting job each one does, because a single-purpose reporting tool usually beats a general analytics platform that treats client reports as an afterthought. Next came published pricing and how it scales, since per-client charges decide the real bill for an agency. Output quality came third, because a report with a wrong number costs more to fix than a month of subscription. Fourth, fit with the ad and email platforms the agency already runs, because a tool that cannot reach real data forces double entry on every report. Fifth, the catch, from free plans that cap clients to enterprise tools that need a sales call before the first trial.
| Check before you buy | What to ask | Why it matters |
|---|---|---|
| Published price | Is the rate on the pricing page | A hidden price is a hidden bill |
| Connector depth | Does it pull your ad and email data | Manual exports eat the time it saves |
| Report design | Does the client read it without help | A confusing report creates support calls |
| Automation | Does it send itself on schedule | A report you must remember is a missed report |
| Trial access | Can you test it on your real accounts | A demo is not a trial |
| Contract terms | Monthly or annual, and what year two costs | Annual billing locks the price but not the need |
Tool by Tool
1. AgencyAnalytics
Starting price From 49 dollars a month. Best for Small agencies with client reports. Watch out Per-client pricing adds up fast.
AgencyAnalytics pulls data from ads, social, email and SEO into white-labelled reports and a client portal, so the client sees the numbers without a monthly email. It covers the channels an agency actually runs, and the templates look professional without design work.
The 49 dollar plan is the sensible starting point for a small agency, because the core connectors sit in the base tier rather than behind an upgrade. AgencyAnalytics also sends reports on schedule, which removes the monthly scramble. Check the per-client pricing first, since the bill grows with the client list.
2. Databox
Starting price From 47 dollars a month. Best for Dashboards that clients can open anytime. Watch out Report design is simpler than rivals.
Databox builds live dashboards from more than 100 sources, so a client can check performance any day instead of waiting for the monthly PDF. The AI features flag anomalies, like a sudden drop in conversions, before the client notices them.
At 47 dollars a month it is a fair price for a dashboard tool, and the starter plan covers a small agency. The trade-off is design: the reports are clean but plainer than AgencyAnalytics. For a team that values live numbers over polish, that trade is usually worth it.
3. Whatagraph
Starting price From 223 dollars a month. Best for Agencies with many clients to report on. Watch out A steep entry price for small teams.
Whatagraph turns campaign data into polished, branded reports with almost no manual work, and it handles dozens of clients from one login. The templates are the best looking on this list, which matters when the report is the main thing the client sees.
The 223 dollar monthly price is steep for a small agency, and it only makes sense once the client count justifies it. Whatagraph also includes cross-channel insights that save the account manager an hour per report. Buy it when reporting is the bottleneck, not before.
4. Looker Studio
Starting price Free. Best for Teams with zero reporting budget. Watch out Every connector beyond Google needs setup.
Looker Studio is Google’s free dashboard tool, connecting to Analytics, Ads and Sheets with no subscription. A team that can build its own templates gets a capable reporting system for nothing, and the reports share easily with clients.
Free is hard to beat, and the Google connectors work well. The catch is the rest: non-Google channels need a paid connector or manual exports, and there is no client portal. Use it when the budget is zero, and move to AgencyAnalytics when the manual work costs more than the subscription.
5. Supermetrics
Starting price From 29 dollars a month. Best for Moving data into Sheets and dashboards. Watch out No reports of its own, it feeds other tools.
Supermetrics moves marketing data into Sheets, Looker Studio and Excel on schedule, so the report always carries fresh numbers without manual exports. It covers the widest connector list here, including the niche ad platforms other tools miss.
At 29 dollars a month it is cheap for what it does, but it is a pipe, not a report: the design still happens in Sheets or Looker Studio. Pair it with Looker Studio for a free-to-cheap stack, and buy a reporting tool only when the design work becomes the bottleneck.
6. Swydo
Starting price From 49 dollars a month. Best for Agencies that want simple scheduled reports. Watch out Fewer connectors than the big rivals.
Swydo builds scheduled reports from ad and social data with a clean template and a simple setup, so an agency can have the first report out in an afternoon. It suits teams that want reporting done, not a reporting project.
The 49 dollar plan covers the core channels, and the price is fair for a small agency. The trade-off is breadth: some niche platforms are missing, so check your channel list first. For a team on the main ad platforms, Swydo is a fast, honest buy.
7. DashThis
Starting price From 42 dollars a month. Best for Freelancers with a handful of clients. Watch out White-labelling needs the higher tier.
DashThis turns campaign data into a shareable dashboard link in minutes, with templates for the common channels and a simple client view. A freelancer with five clients can send the month’s reports in an afternoon instead of a week.
At 42 dollars a month it is the cheapest paid reporting tool here, and the starter plan covers a small client list. White-labelling sits on the higher tier, so check that before you promise branded reports. For a freelancer, the speed alone pays for it.
8. ReportGarden
Starting price From 79 dollars a month. Best for Agencies that also invoice clients. Watch out Reporting plus billing in one login.
ReportGarden combines reporting with invoicing and budget tracking, so the agency sees the campaign numbers and the client billing in one place. It suits an agency that wants the commercial side beside the performance side.
The 79 dollar plan is the sensible entry, because the reporting and the invoicing both sit in the base tier. ReportGarden is less polished than Whatagraph on design, but stronger on the business side. Pick it when the invoice matters as much as the chart.
9. TapClicks
Starting price Pricing on request. Best for Large agencies with many data sources. Watch out No list price, and a rollout that takes real effort.
TapClicks pulls data from hundreds of sources into dashboards and reports, with workflow tools for large agency teams. It is built for scale, with the connector depth and the permissions a big agency needs.
The trade-off is the buying process itself, with no published price and a rollout that takes weeks. TapClicks suits an agency with dozens of clients and a reporting team. For a small agency, it is the wrong scale and the wrong price.
10. Porter Metrics
Starting price From 15 dollars a month. Best for Looker Studio users who need more connectors. Watch out It feeds Looker Studio, it is not a report tool.
Porter Metrics adds connectors to Looker Studio for the channels Google misses, at a low monthly price per connector. A team already happy with Looker Studio can add Facebook, LinkedIn or TikTok data without leaving the free dashboard.
At 15 dollars a month per connector it is cheap, and the setup takes minutes. Porter is a connector, not a reporting tool, so the design still happens in Looker Studio. Pair it with Looker Studio for the cheapest capable stack on this list.
The Comparison Table, Explained
The table below puts the top 10 ai tools for campaign reporting side by side on price, best job and free plan, so you can compare the published prices against the quote-only tools at a glance.
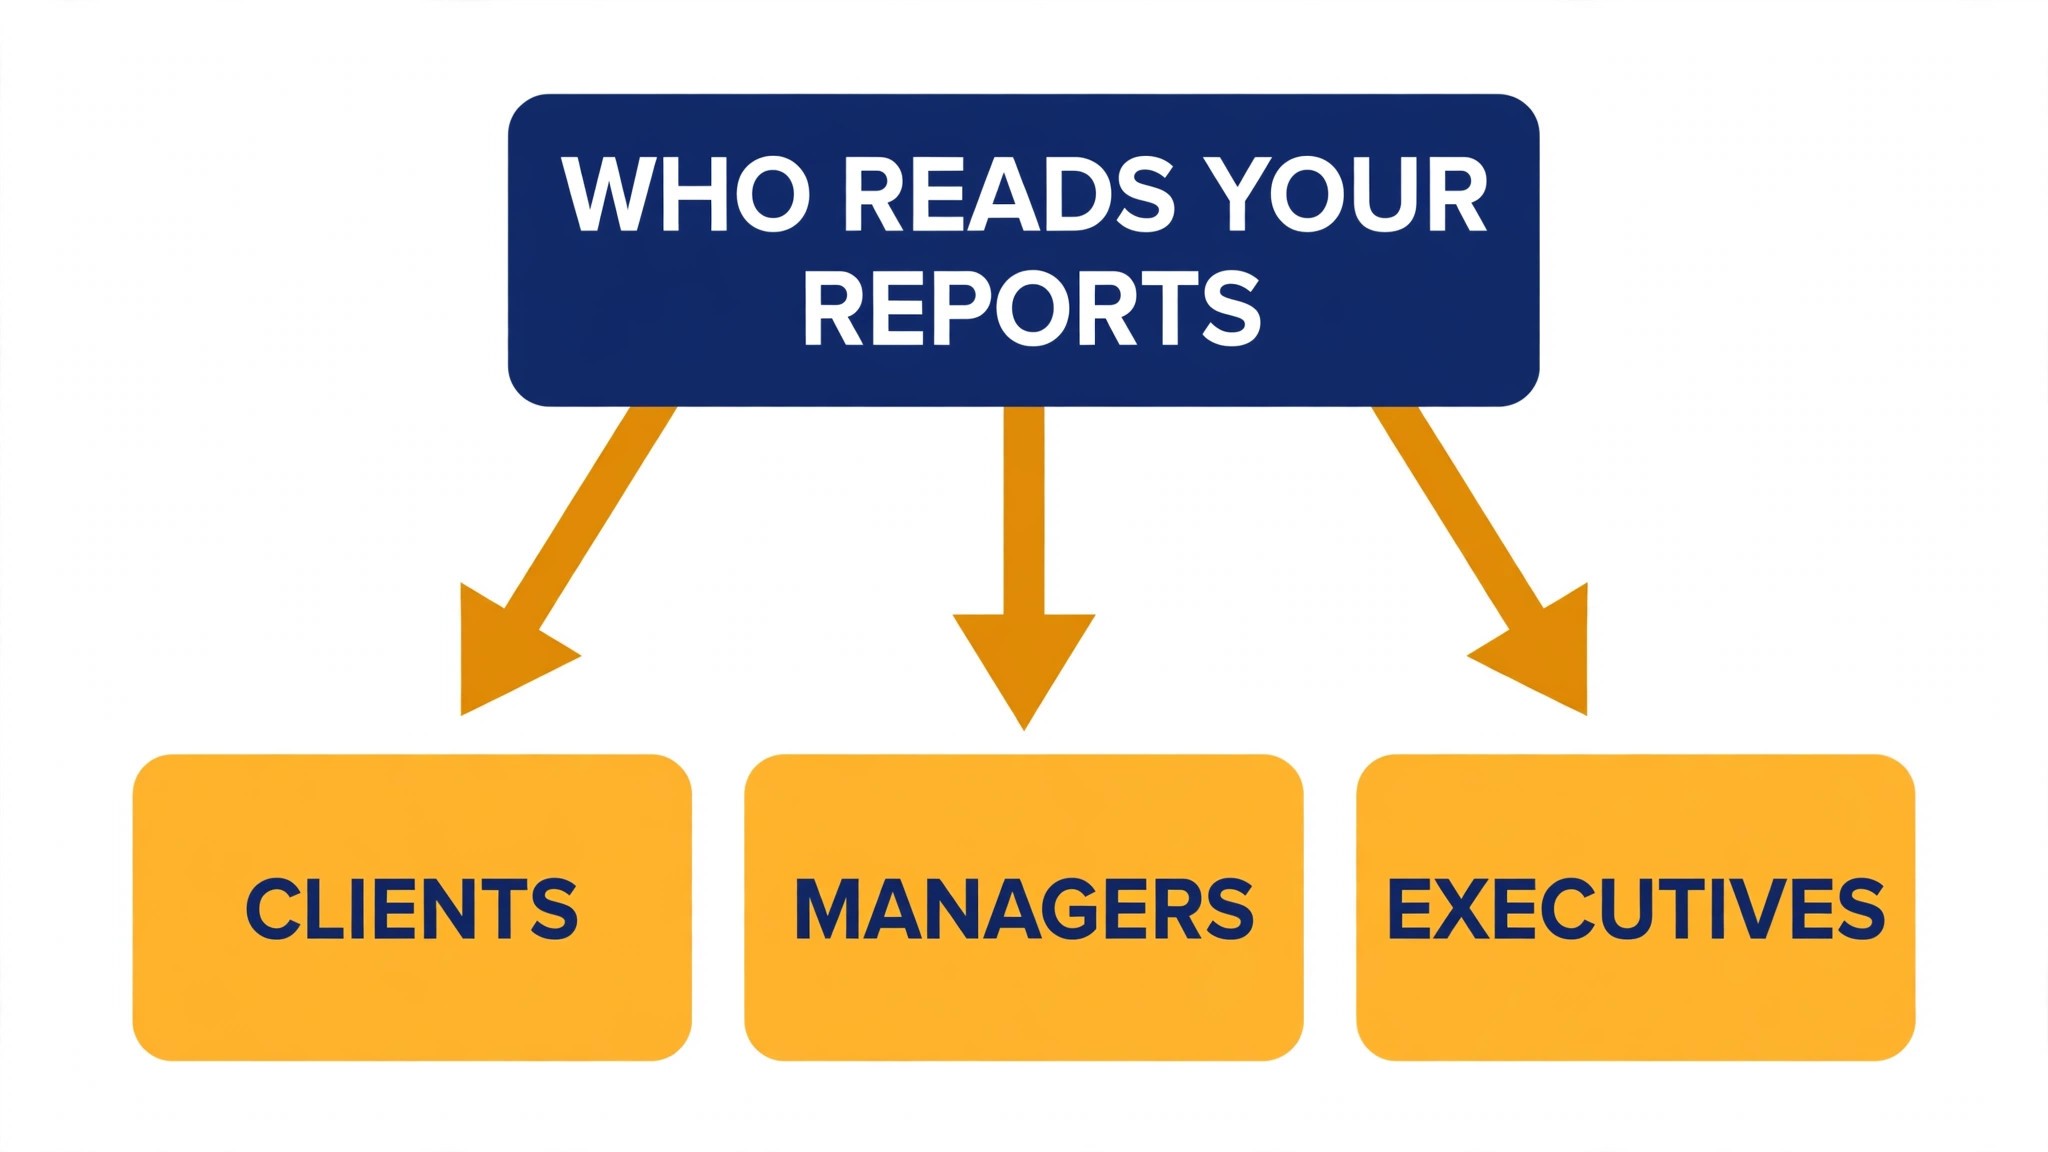
The fastest way through the table is by reader, since agencies pay more for a bargain tool that confuses a client than for a pricier one that lands first time. A report that needs explaining eats another hour of calls. Check what each tool does best, then look at the price, and the choice usually settles in under a minute.
| Tool | Starting price | Best for | Free plan |
|---|---|---|---|
| AgencyAnalytics | From 49 dollars a month | Small agencies with client reports | Trial |
| Databox | From 47 dollars a month | Dashboards that clients can open anytime | Trial |
| Whatagraph | From 223 dollars a month | Agencies with many clients to report on | Trial |
| Looker Studio | Free | Teams with zero reporting budget | Yes |
| Supermetrics | From 29 dollars a month | Moving data into Sheets and dashboards | Trial |
| Swydo | From 49 dollars a month | Agencies that want simple scheduled reports | Trial |
| DashThis | From 42 dollars a month | Freelancers with a handful of clients | Trial |
| ReportGarden | From 79 dollars a month | Agencies that also invoice clients | Trial |
| TapClicks | Pricing on request | Large agencies with many data sources | No |
| Porter Metrics | From 15 dollars a month | Looker Studio users who need more connectors | Trial |
Reading the Price Tags
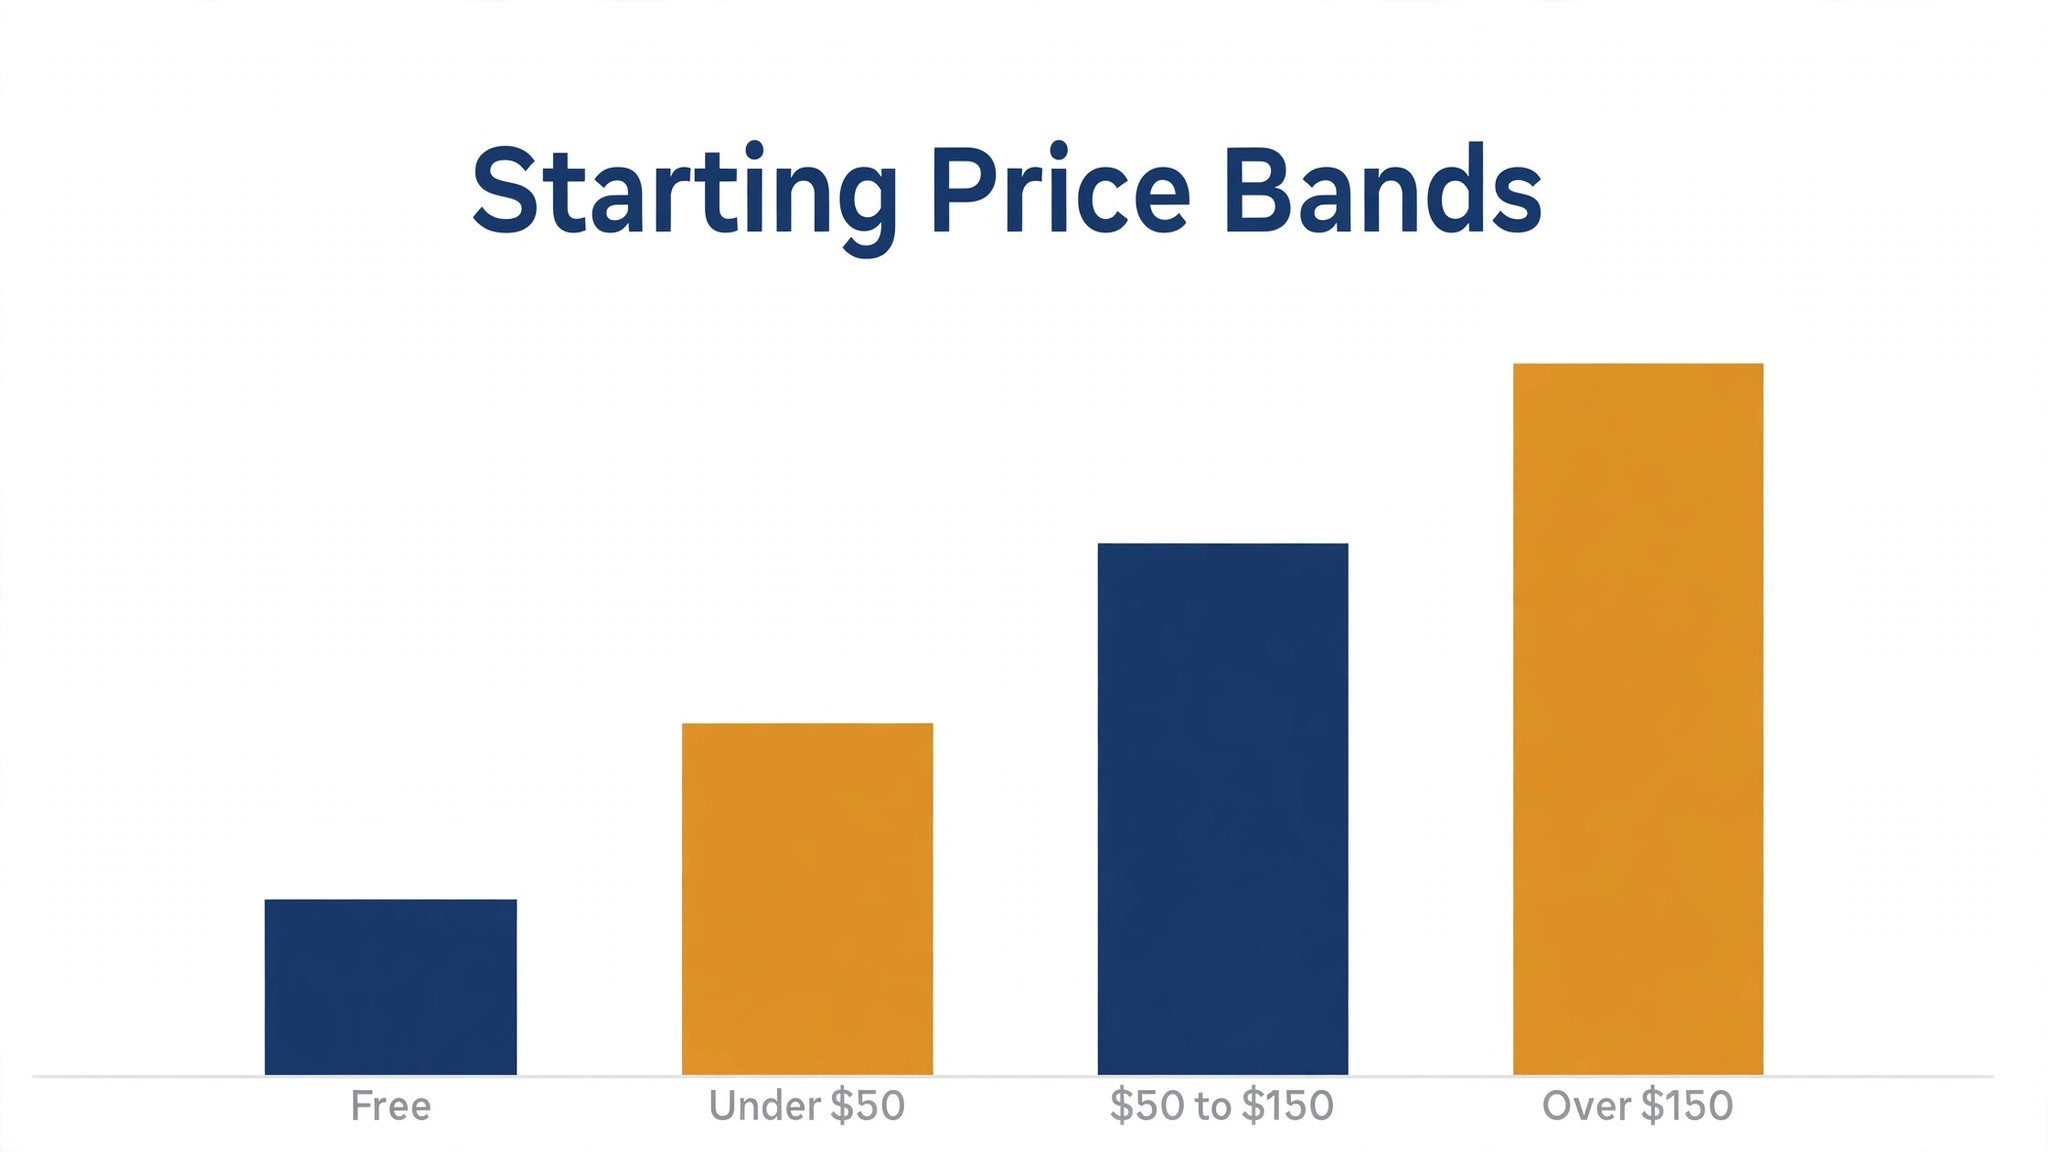
Most agencies overpay in year one by buying the top tier for a connector they use once. The reporting tools on this list charge 15 to 223 dollars a month at the entry tier, and the gap between tiers is usually the connector list, the number of clients you can report on, and the white-labelling. Buy the tier that covers your current clients, and upgrade only when a client asks for something the tier cannot produce.
Free plans deserve a careful look, because two tools on this list let you start without a card. A free tier that caps clients to one, or watermarks the report, is a trial in disguise. Count how many clients you will actually report on in a quarter, check whether the free tier covers them, and treat a free plan that fits as a genuine saving rather than a stepping stone.
The Numbers Behind the Choice
Clients judge an agency on the report more than on the work, because the report is the only part of the work most clients ever see. A campaign can perform well and still lose the client if the report hides the result behind jargon and raw tables. The best reporting tools on this list lead with the outcome, then the numbers that prove it, and they keep the whole report short enough to read over a coffee.
The average agency account manager spends between four and eight hours a month per client on reporting when the work is manual, and most of that time goes into copying numbers between platforms. An automated report pulls the same numbers in minutes, which means the manager can spend the saved hours on the analysis and the recommendations, which is the part the client actually pays for. That is the real saving, and it is larger than the subscription.
Attribution is the hardest question in campaign reporting, and no tool on this list answers it perfectly. A customer who sees an ad, reads an email and then searches for the brand will be counted differently by every platform involved. Honest reports show the numbers from each platform side by side and explain the overlap, rather than pretending a single source of truth exists. Clients trust a report that admits the overlap more than one that hides it.
Report frequency matters. Monthly reports are the standard, but clients who receive a short weekly snapshot alongside the monthly deep dive renew at higher rates, because they never feel out of touch with their spend. Tools that automate a weekly summary, even a one-page version, give the agency a regular touchpoint that costs almost nothing once it is set up.
White-labelling is worth more than it looks on a pricing page. A report that carries the agency brand, the agency colours and the agency domain reads as the agency work, while a report that carries the vendor brand reads as rented software. Clients who see their agency brand on every page are more likely to credit the agency for the result, which is exactly what the agency wants at renewal time.
The connector list is the feature that decides most purchases in this category. An agency that runs ads on Meta, Google and TikTok, email on one platform and SEO on another needs a tool that pulls all five without manual exports. A missing connector means a monthly manual job that defeats the purpose of the tool, so the connector list should be checked before the price is even considered.
How to Choose Without Overbuying
Start from the report that takes the most hours, not from the vendor homepage. An agency drowning in client reports needs a different tool from one that needs executive dashboards, and a freelancer needs something else again. The tool that fixes the slowest part of your reporting week pays for itself first, and the rest can wait.
Cost the whole reporting stack, not the headline number. The table below prices year one for a solo freelancer and for a small agency on the common combinations, at published starting prices. Ask for per-client charges in writing before signing, since those lines surprise agencies, and annual billing usually cuts about twenty percent off the monthly rate.
| Stack | Monthly cost | What it covers |
|---|---|---|
| Looker Studio alone | Free | One tool for the main job |
| AgencyAnalytics alone | Lowest paid start | Core tool plus a client portal |
| Databox plus Looker Studio | Mid-range | Core tool plus a free dashboard |
| Whatagraph plus Databox | Higher | Core tool plus a specialist |
Best Pick by Job
Pick from the table below by the reporting job you do most. The top 10 ai tools for campaign reporting are not ranked by features alone; they are ranked by which job each one actually finishes, so the pick that matches your week is the pick that will still be in your stack a year from now.
| Your job | Best pick | Why it wins |
|---|---|---|
| Small agencies with client reports | AgencyAnalytics | Client reports with a portal |
| Dashboards that clients can open anytime | Databox | Live dashboards for clients |
| Agencies with many clients to report on | Whatagraph | Beautiful reports at scale |
| Teams with zero reporting budget | Looker Studio | Free dashboards from Google |
| Moving data into Sheets and dashboards | Supermetrics | Data pipes for reporting |
| Agencies that want simple scheduled reports | Swydo | Simple reports that send themselves |
| Freelancers with a handful of clients | DashThis | Quick reports for small client lists |
| Agencies that also invoice clients | ReportGarden | Reports, invoices and budgets together |
| Large agencies with many data sources | TapClicks | Enterprise reporting at scale |
| Looker Studio users who need more connectors | Porter Metrics | Cheap connectors for Looker Studio |
Testing Before You Pay
A trial tells agencies more in five working days than a month of reading reviews, but only when the trial runs on real accounts. Pick the two tools that look closest after the shortlist, run them side by side on the same campaigns, and score them on time saved, edits needed and how the report reads to a client. Never trial on a demo file, because a demo hides the rough edges real data exposes.
Keep a simple log through the trial week, noting the daily reporting task, the minutes it took, the edits made and whether the report could go to a client unchecked. When the week ends, that log makes the call. The tool with the best log wins, even when it was not the expected favourite, because the log measures your own campaigns, not the vendor demo.
| Day | What to test | What good looks like |
|---|---|---|
| Day 1 | Setup and first real job | Working in under an hour, no IT ticket |
| Day 2 | The hardest job you do | Output needs light edits, not a rewrite |
| Day 3 | Integration with your core system | Data flows without double entry |
| Day 4 | A colleague tries it cold | They finish a job without asking for help |
| Day 5 | Count the time and the cost | Hours saved beat the monthly price |
Buying Mistakes to Skip
Mistake one is the cheapest plan, when the connector you need sits two tiers up. Check every tier on the pricing page and pay for the tier that does the daily reporting job, not the tier that looks cheap. Mistake two is rolling the tool out to the whole team before one person has tried it for a week, since a favourite for one and a burden for five is a cost, not a system.
The third mistake is skipping the client read-through. Ask a client to read the report cold, watch where they get stuck and check the numbers before the first real report goes out, because fixing a report after a client has questioned it costs far more than checking it first. The fourth mistake is judging the tool on its best day, so trial it on the hardest campaign itself and let the hard campaign decide.
Your Questions, Answered
Which tool gives agencies the cheapest good start
Looker Studio is the cheapest credible start on this list at free, with Porter Metrics close behind at 15 dollars a month. The top 10 ai tools for campaign reporting include free tiers and free plans, so start with the report type you send most, trial the free tier on real accounts, and add a specialist only when the general tool cannot pull a channel you are judged on. That is the cheapest way to build a reporting stack, with no payment for features never used.
Can a client tell the report was built with AI
They can, when you send the template unchanged. AI tools draft a usable first version, but the facts, the numbers and the judgement still come from the person doing the reporting. An output that goes out unedited reads generic, and clients notice generic reports fast. Use the AI to beat the blank page, then change the details, the wording and the checks, so the result sounds like your agency and not the tool.
For a small agency, which reporting tool wins
AgencyAnalytics is the pick for a small agency, starting at 49 dollars a month with almost no setup, while Databox at 47 dollars a month is the strongest all-round option as the client list grows. The top 10 ai tools for campaign reporting were ranked by the job each one finishes, not by the size of the feature list, so a small agency should buy the tool that fixes its slowest weekly job first and add a second tool only when a specific limit starts costing time.
How much will a small team spend on reporting tools in year one
Plan on 40 to 80 dollars a month in year one for a general reporting tool such as AgencyAnalytics, rising to 150 to 300 dollars a month with a specialist such as Whatagraph added. Multiply the headline price by client count when you pay per client, since those charges surprise buyers. Price the whole stack and trial each tool on real accounts before signing an annual contract.
Do agencies need a specialist tool as well as a general one
Not always. Most agencies get by with one general tool for months, and a separate specialist only earns its place when a specific reporting task runs every week and the general tool cannot do it well. Count the campaign reporting hours from last week first. When a reporting job takes hours and the specialist cuts it to minutes, buy it, and when the job already takes minutes, the specialist is a cost.
Do these reporting tools offer a trial before payment
Most tools on this list offer a free plan or a free trial, and AgencyAnalytics and Databox both let agencies test on real accounts before paying. Use the trial on the report type you send most, not on a demo, and count the time saved and the edits each output needs. A trial that covers a real week tells agencies more than a sales call, and a tool that will not trial is one to be careful about.
The Verdict, in Brief
If you buy one tool this quarter, pick AgencyAnalytics for a small agency that needs client reports and a portal, and Looker Studio when the budget is zero and the team can build. AgencyAnalytics is the easiest paid place to start at 49 dollars a month, and Looker Studio is free. The top 10 ai tools for campaign reporting earn their keep by giving you back the day between the data and the send, and both of these do that from the first month.
Whatever you pick, trial it on a real month of campaigns, count the reports it produces and the edits each one needs, and keep a human eye on every number before it goes to a client. Every reporting tool here can explain a campaign clearly. The difference is whether the reporting tool matches the reports you actually send, and whether you measure the return in renewals and hours saved rather than in features used.