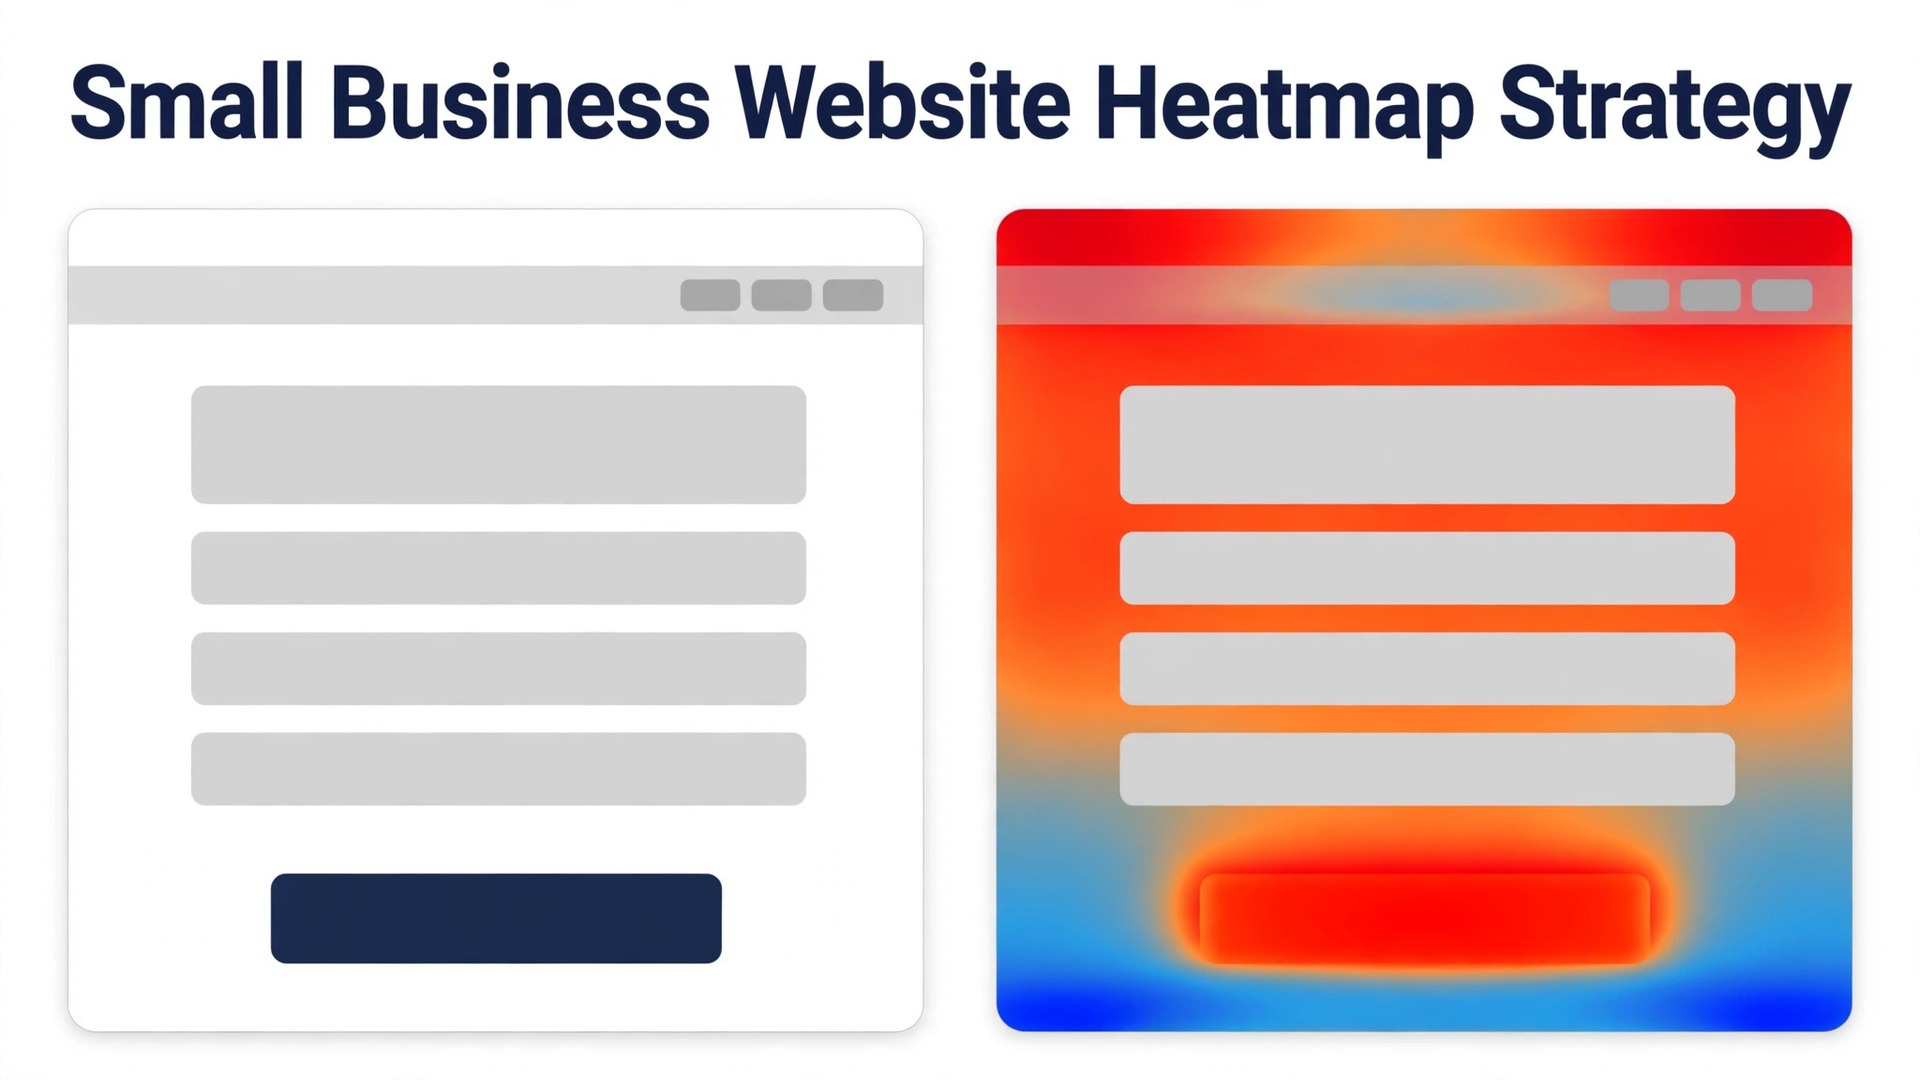
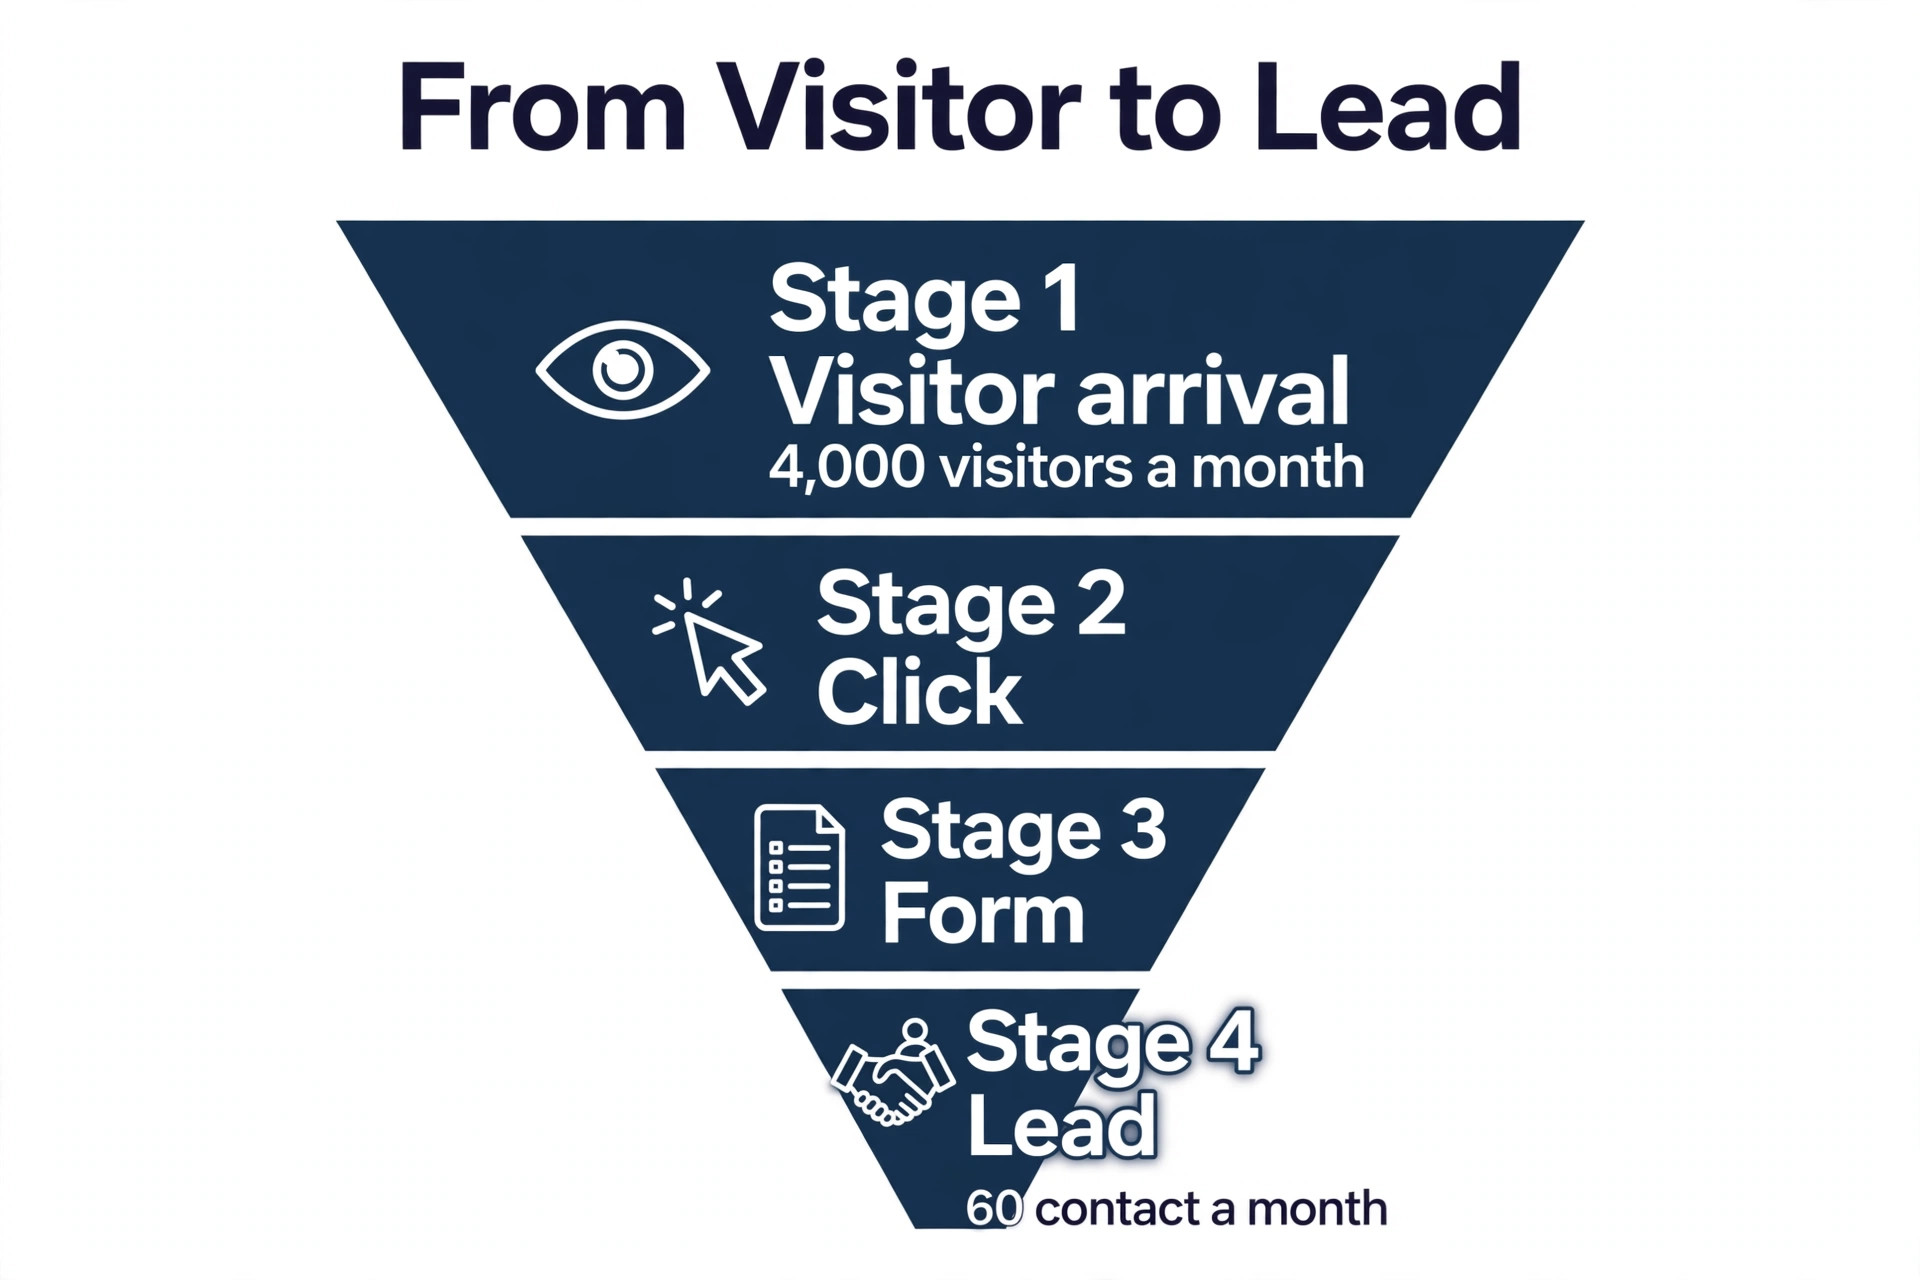
Your analytics say the homepage gets 4,000 visitors a month and 60 of them contact you. The numbers do not say why the other 3,940 leave, and that gap is exactly what a small business website heatmap strategy is built to close. A heatmap shows where visitors click, how far they scroll and where they quit, and a recording shows the hesitation in between.
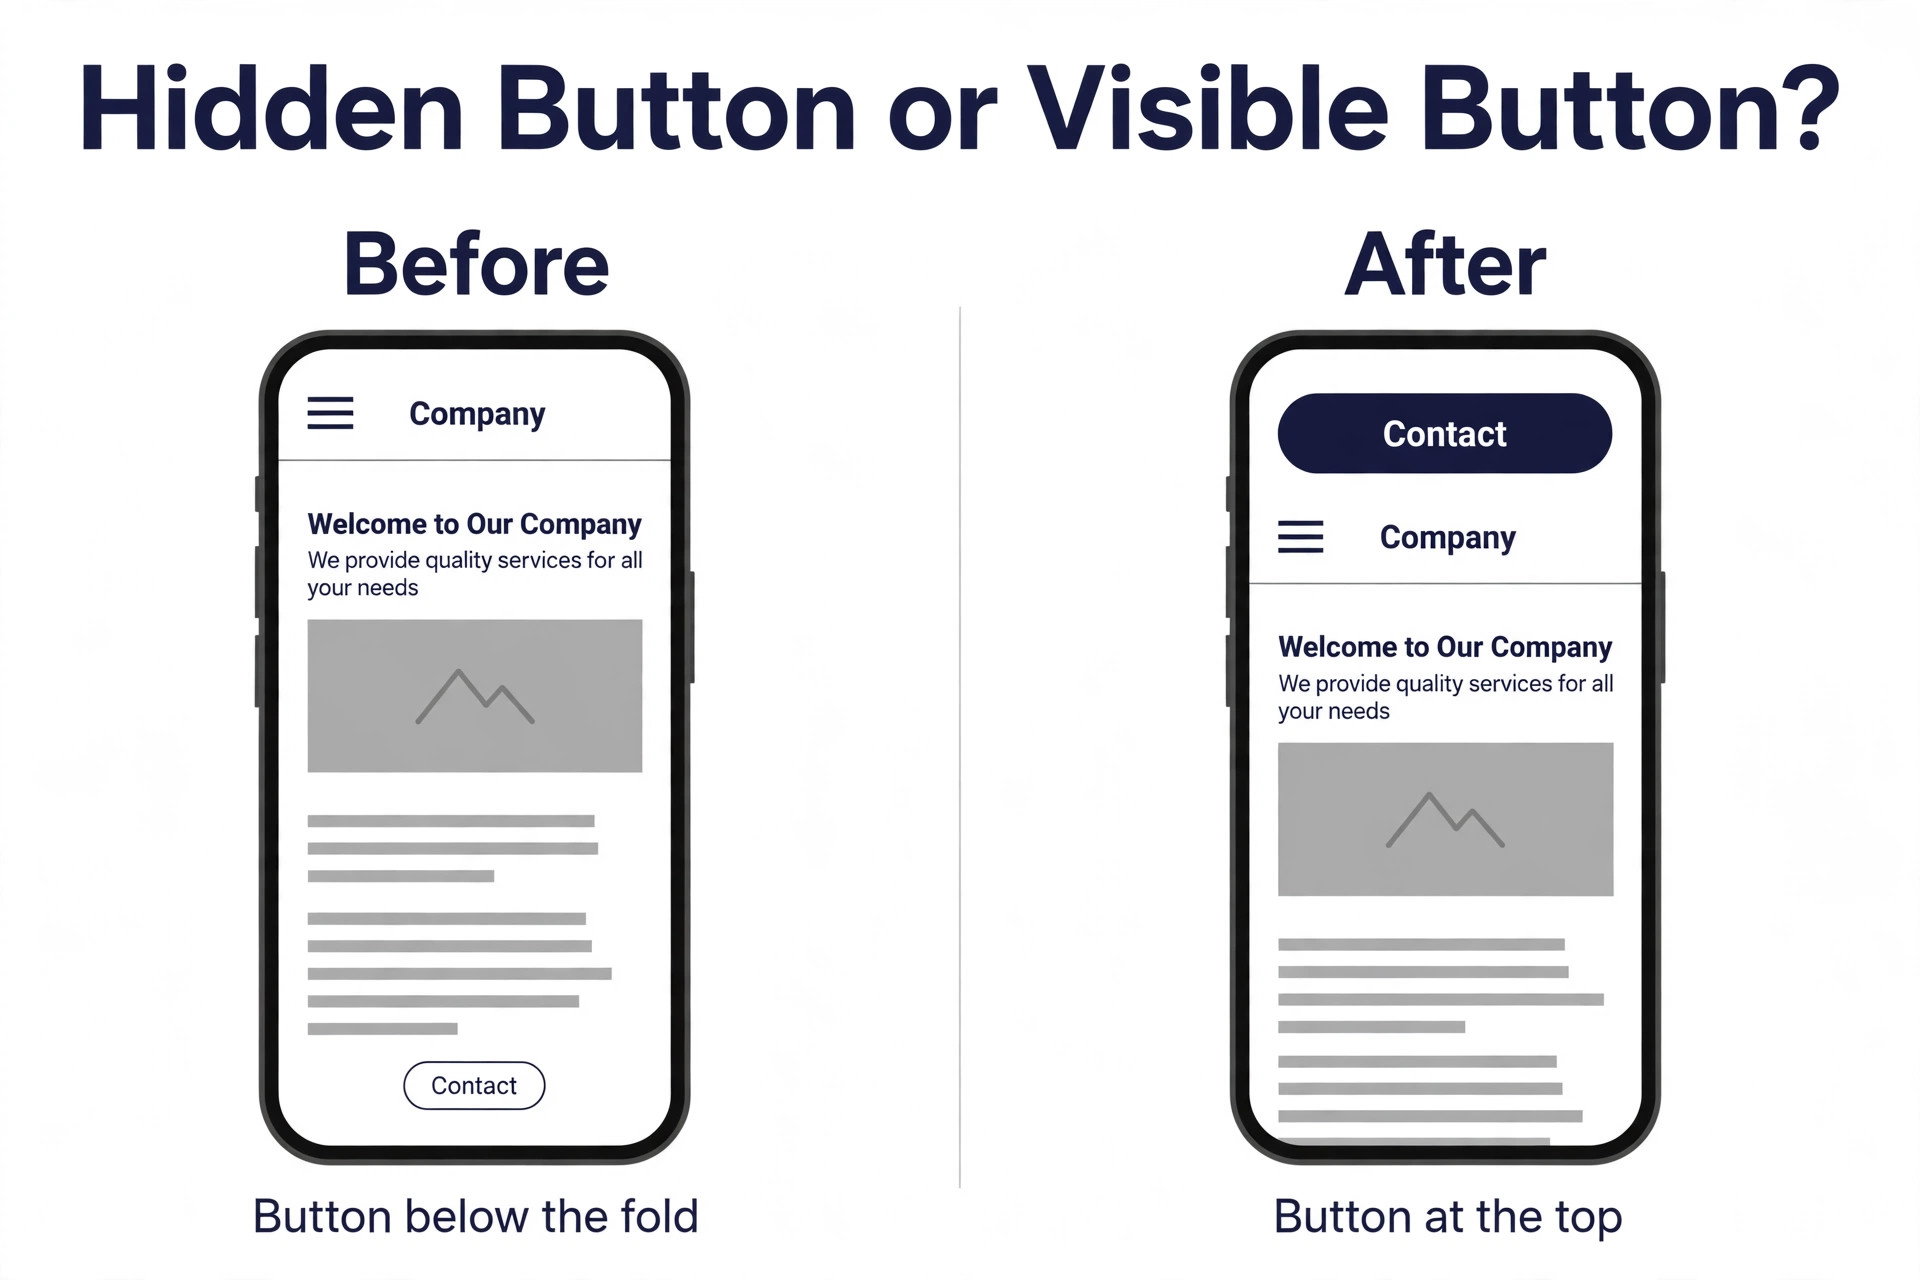
Most small business sites fail in the same few places. The phone number sits below the fold on mobile. The main button looks like plain text. The form asks for six fields when two would do. None of those problems show up in a traffic report, because the traffic report only counts arrivals. A heatmap shows behaviour, and behaviour is what a fix needs.
This guide gives you a working strategy, not a tour of features. You will learn which pages to watch first, how much data you need before you trust what you see, how to read each type of heatmap, and how to order the fixes so the first change pays for the tool.
Prices in this guide were checked against vendor pricing pages and current 2026 roundups in November 2026. Heatmap tools change their free limits often, and Hotjar now operates under Contentsquare after the two companies merged in July 2025, so confirm the current plan limits on the pricing page before you commit.
What a Heatmap Actually Shows
A click map shows where visitors tap or click on a page, with the hottest colour on the elements that get the most attention. When the logo gets more clicks than the main button, the button is failing. When a photo that is not a link gets hundreds of clicks, visitors expect it to do something. A click map is the fastest way to find the gap between what you built and what visitors think you built.
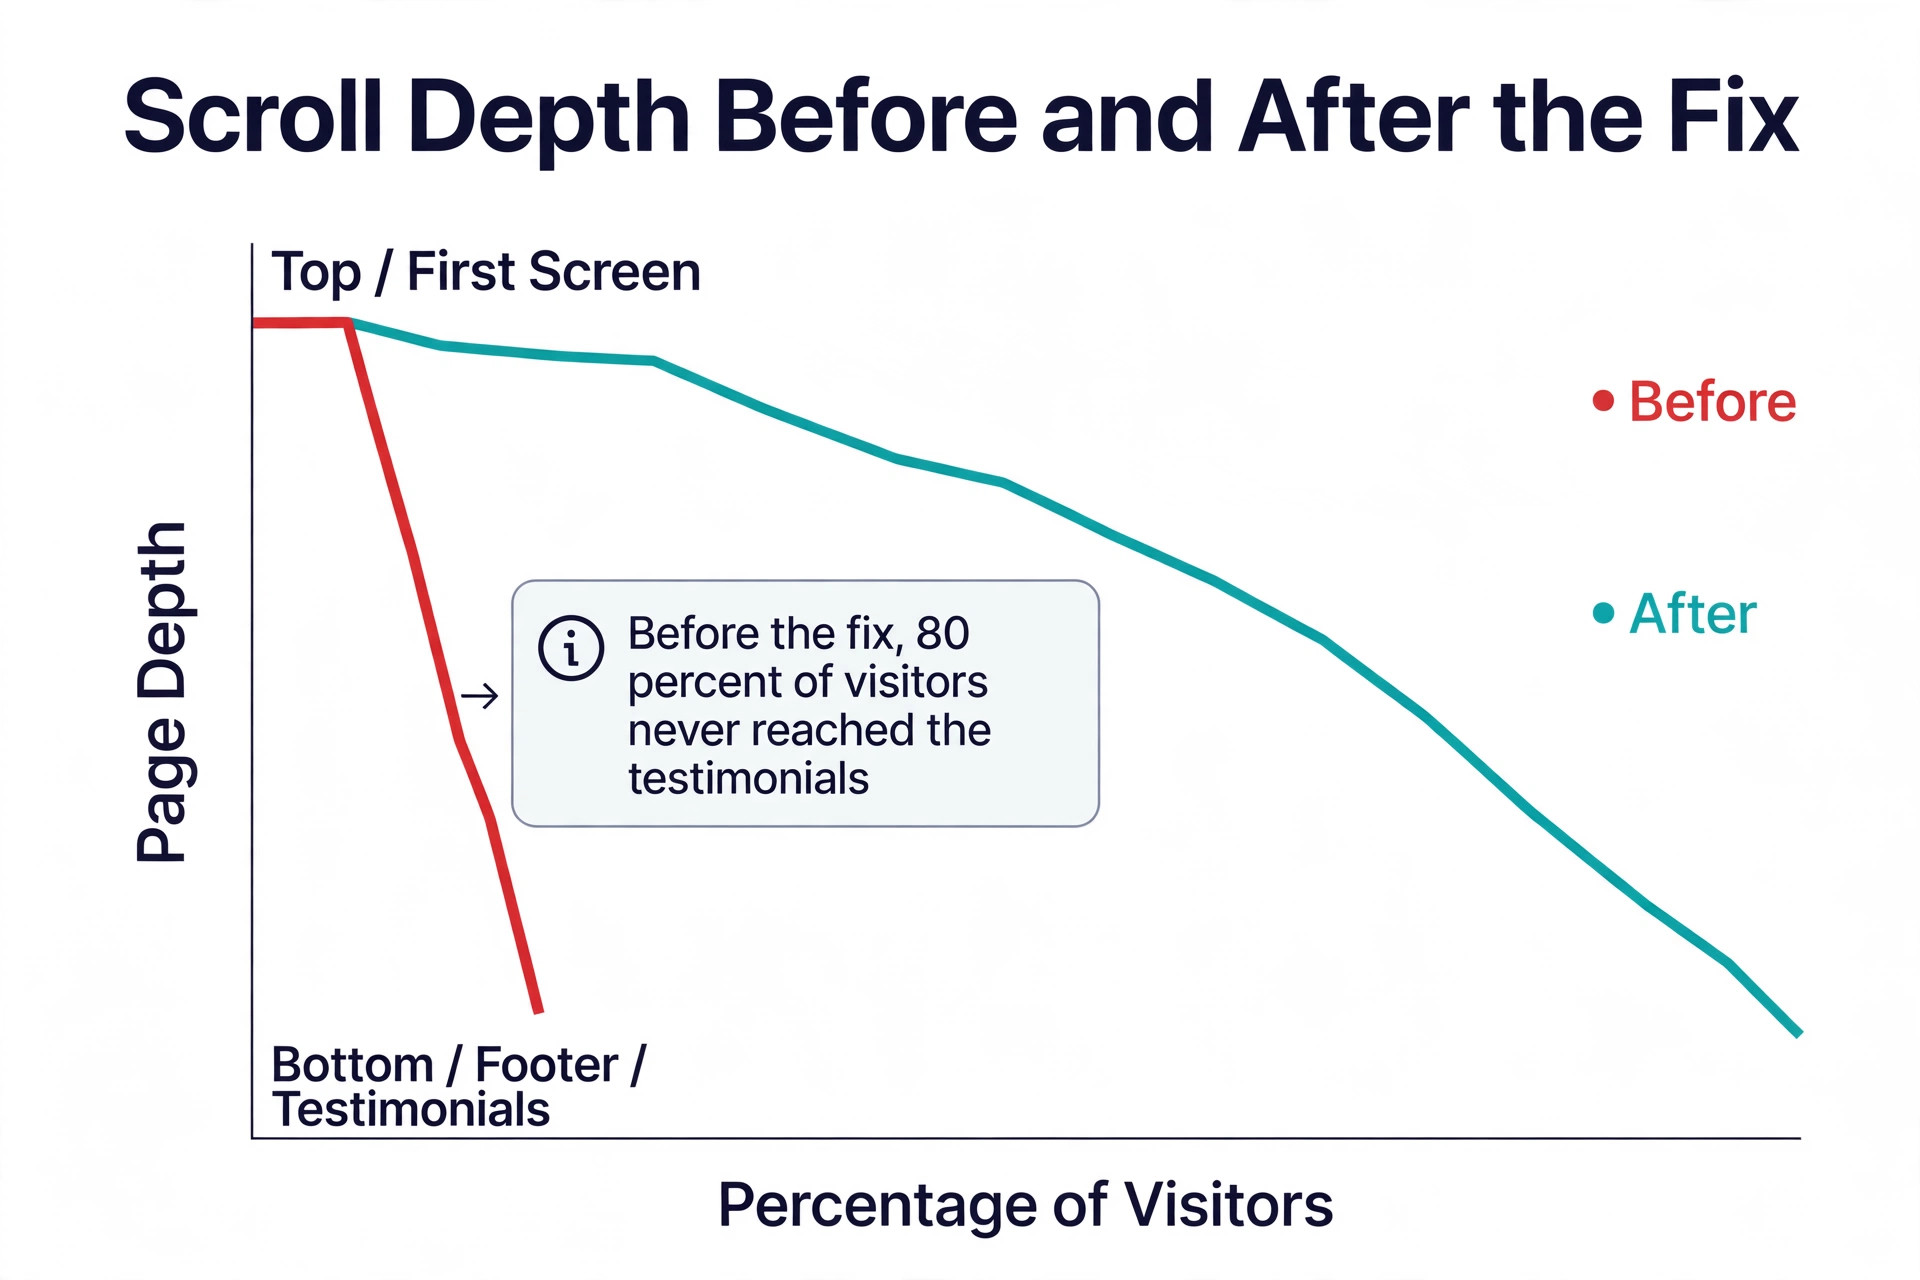
A scroll map shows how far down the page visitors get, and where the drop off is steepest. If 80 percent of visitors never reach the testimonials, the testimonials are not a trust problem, they are a placement problem. If the drop off is sharp just below the first screen, the top of the page is not earning the scroll, and the fix belongs at the top, not at the bottom.
A move map, sometimes called an attention map, tracks where the mouse moves and hovers, which is a rough proxy for where the eyes go. It is the least reliable of the three, because a mouse can rest in one place while the eyes read elsewhere. Use it to confirm what the click and scroll maps already suggest, not as evidence on its own.
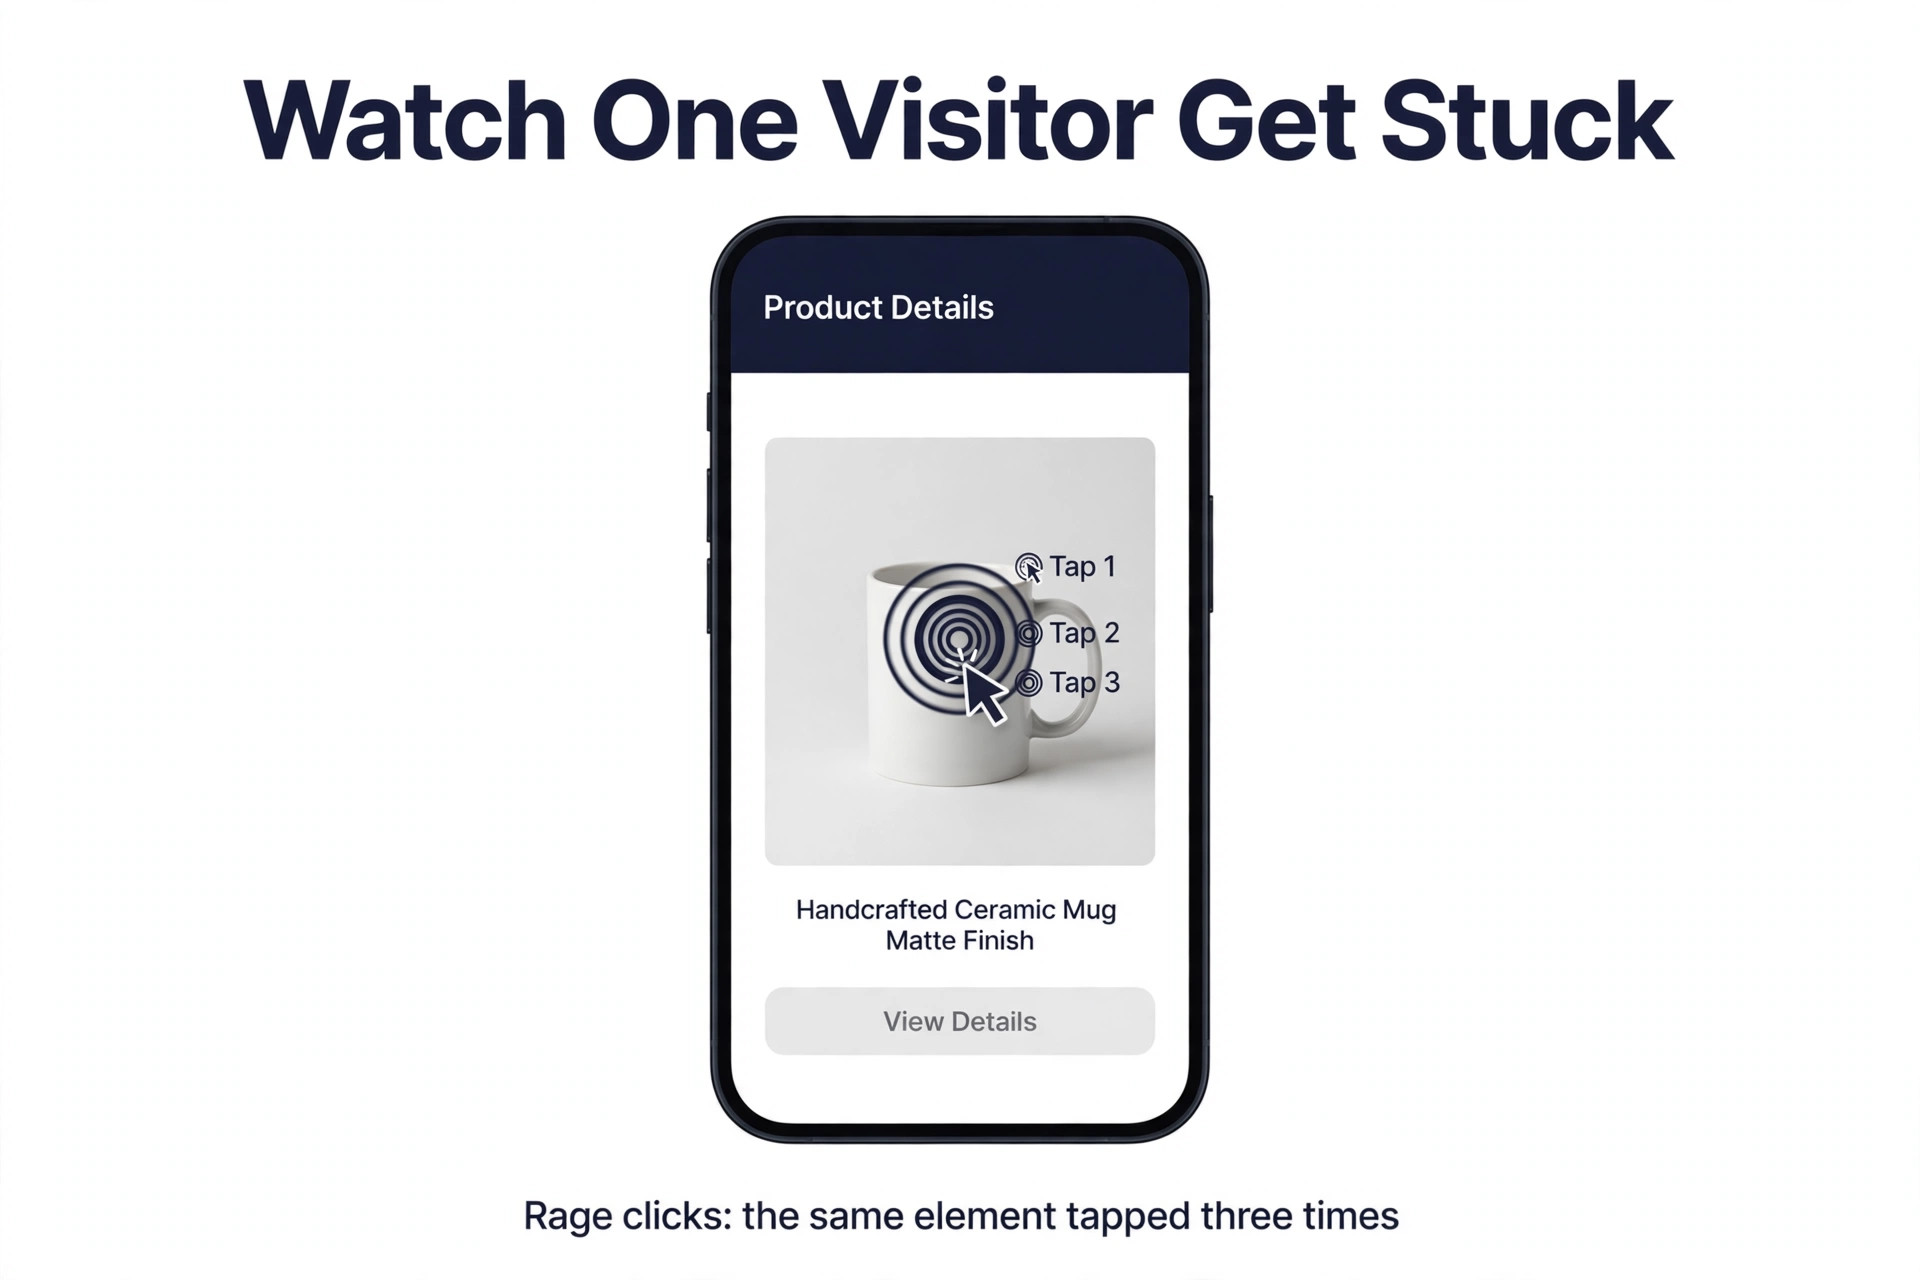
Session recordings are the companion to every heatmap. A heatmap shows the pattern across a thousand visitors. A recording shows one visitor getting stuck, clicking the same dead element three times, scrolling up and down looking for a price, and leaving. Watch 20 recordings of your busiest page and you will find two or three fixes that no aggregate report could have shown you.
How Much Data You Need Before You Act
A heatmap built on 50 visitors is a guess, and a fix built on a guess is a gamble. The rule for a small site is simple. Collect at least 1,000 pageviews on a page before you change anything based on its heatmap, and 2,000 if the page is a product or a service page with real money behind it. Below that number, one unusual visitor can paint a hot spot that means nothing, and a fix based on it can make the page worse.
Time matters as much as volume. A heatmap built from one weekend of traffic will reflect weekend visitors, who behave differently from weekday visitors, and a heatmap built from a sale week will reflect bargain hunters rather than your normal audience. Let the tool run for two full weeks on your main pages before you read it seriously. The free tools make this easy, because Microsoft Clarity has no session cap and Hotjar now gives away up to 200,000 sessions a month on its free plan.
Segment before you judge. Mobile and desktop visitors behave like different audiences, and a heatmap that mixes them hides the truth for both. A button that works on desktop can be too small to tap on a phone. Read the mobile map and the desktop map separately, and fix the mobile version first when the traffic is mostly mobile.
The Pages to Watch First
| Priority | Page | What to look for |
|---|---|---|
| 1 | Homepage | Whether visitors reach the main offer and the contact button |
| 2 | Top service or product page | Whether visitors reach the price and the buy button |
| 3 | Contact or booking page | Where the form loses people and which fields cause exits |
| 4 | Pricing page | Whether visitors compare plans or leave at the first price |
| 5 | Checkout or quote page | Which step loses the most visitors and why |
| 6 | Top blog post | Whether readers reach the call to action at the end |
In any small business website heatmap strategy, the page order is the first decision. Start with the homepage and the top service page, because those two pages carry most of your traffic and most of your money. A fix on a page that gets 50 visitors a month is a hobby. A fix on a page that gets 3,000 visitors a month is a revenue change.
The contact page deserves special attention, because it is where a visitor becomes a lead. Watch the form field by field, and look for the field where visitors stop. A form that asks for a phone number, a company name and a budget before it asks for an email will lose people at the phone number field, and the fix is to ask for less, not to redesign the page.
Small Business Website Heatmap Strategy in Six Steps
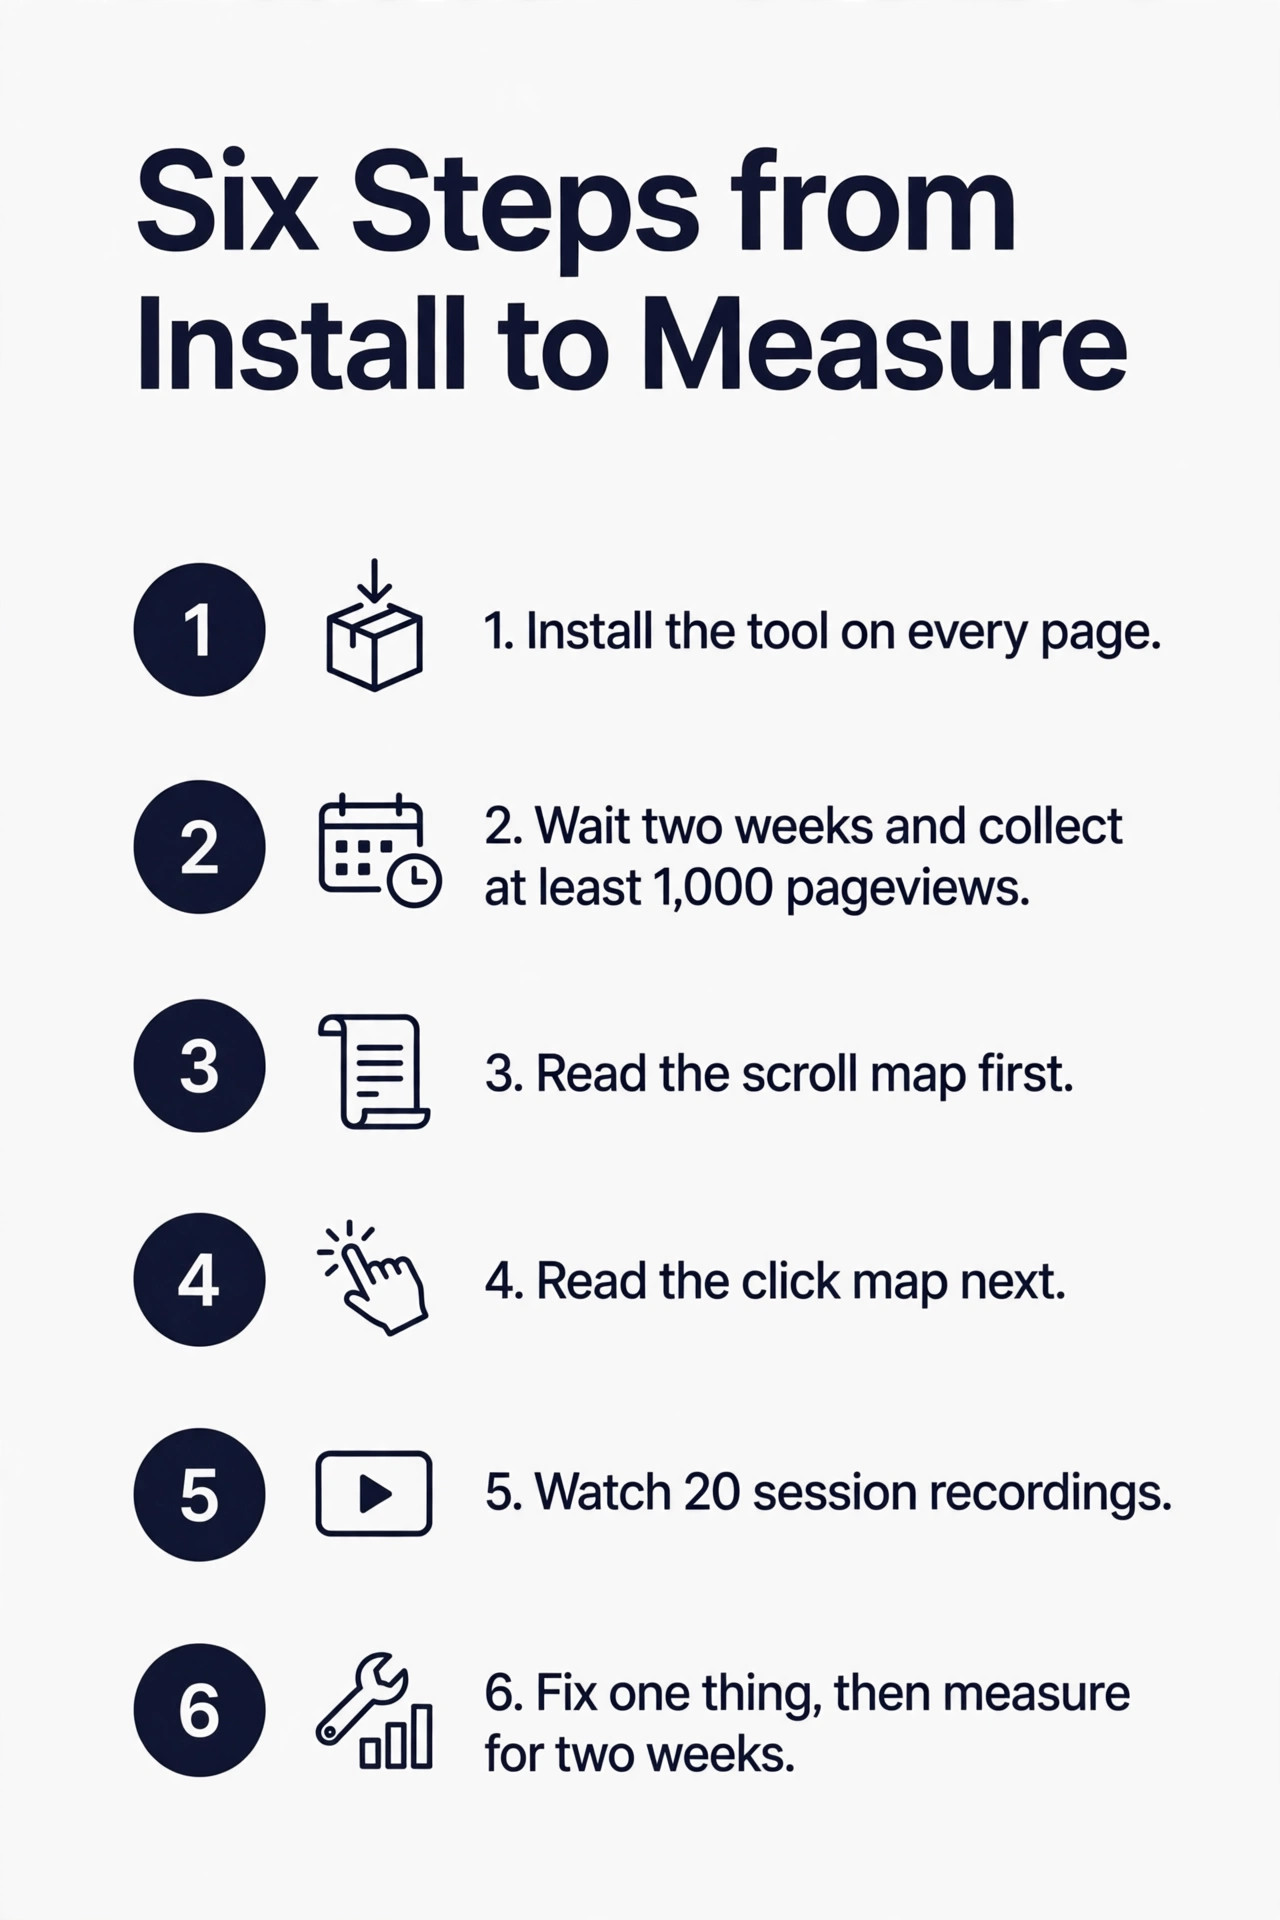
A heatmap strategy is a routine, not a one off project, and the routine below takes about two hours a month once the tool is installed. Follow it in order, and resist the urge to fix the first thing you see.
- Install the tool on every page. One tracking snippet covers the whole site, and installing it only on the homepage leaves the pages that make money unwatched. Microsoft Clarity takes minutes, and Hotjar takes the same.
- Wait two weeks and collect at least 1,000 pageviews per page. Do not read the maps daily, because daily maps are noise. Let the data settle, and check that mobile and desktop are both represented.
- Read the scroll map first. Find the point where the drop off is steepest, and note what sits just above it and just below it. The content above the drop off is what failed to earn the scroll, and the content below it is what nobody sees.
- Read the click map next. List every element that gets clicks but is not a link, and every link that gets almost no clicks. The first list is a set of missing links. The second list is a set of dead calls to action.
- Watch 20 session recordings. Pick recordings from the page with the worst drop off, and watch for rage clicks, which are repeated clicks on one element, dead clicks on elements that do nothing, and excessive scrolling, where a visitor scrolls up and down looking for something. Each pattern maps to one fix.
- Fix one thing, then measure for two weeks. Change the button, move the price, or cut the form fields, and do not change anything else on that page at the same time. A single change with a before and after reading is evidence. Five changes at once are a guess.
Reading the Signals and Choosing the Fix
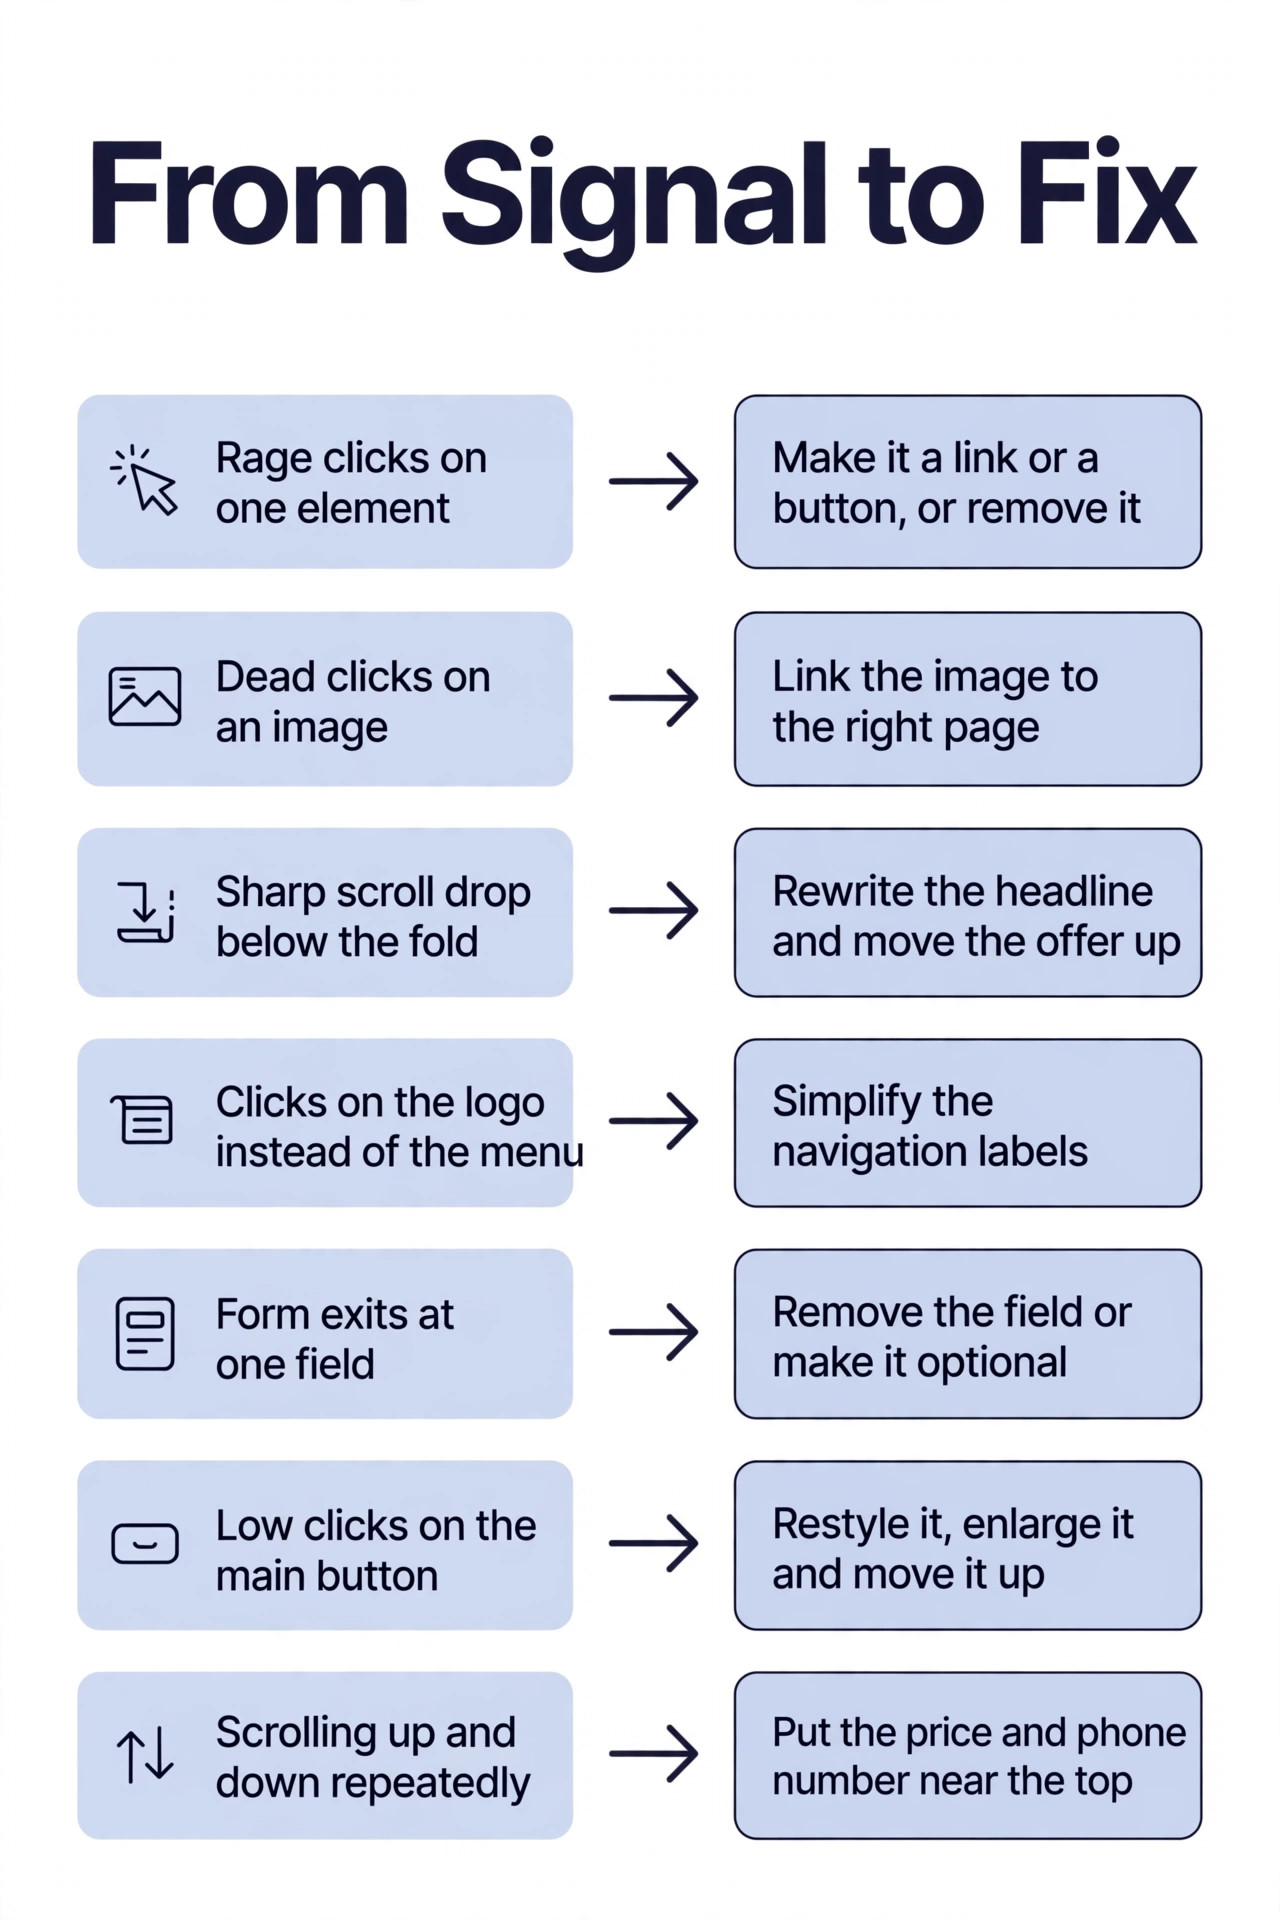
| Signal | What it means | Fix first |
|---|---|---|
| Rage clicks on one element | Visitors expect it to work and it does not | Make it a link or a button, or remove it |
| Dead clicks on an image | Visitors think the image leads somewhere | Link the image to the relevant page |
| Sharp scroll drop off below the fold | The top of the page did not earn the scroll | Rewrite the headline and move the offer up |
| Clicks on the logo instead of the menu | Visitors are lost and use the logo to reset | Simplify the navigation labels |
| Form exits at one field | That field feels intrusive or unclear | Remove it or make it optional |
| Low clicks on the main button | The button looks like plain text or sits too low | Restyle it, enlarge it and move it up |
| Scrolling up and down repeatedly | Visitors cannot find the price or the contact details | Put the price and the phone number near the top |
This table is the heart of any small business website heatmap strategy, because it turns a pattern into a job. A heatmap that only tells you what is hot is a picture. A heatmap plus this table is a work list, and the work list is what earns the money. Print it, keep it beside the dashboard, and use it every time you read a new map.
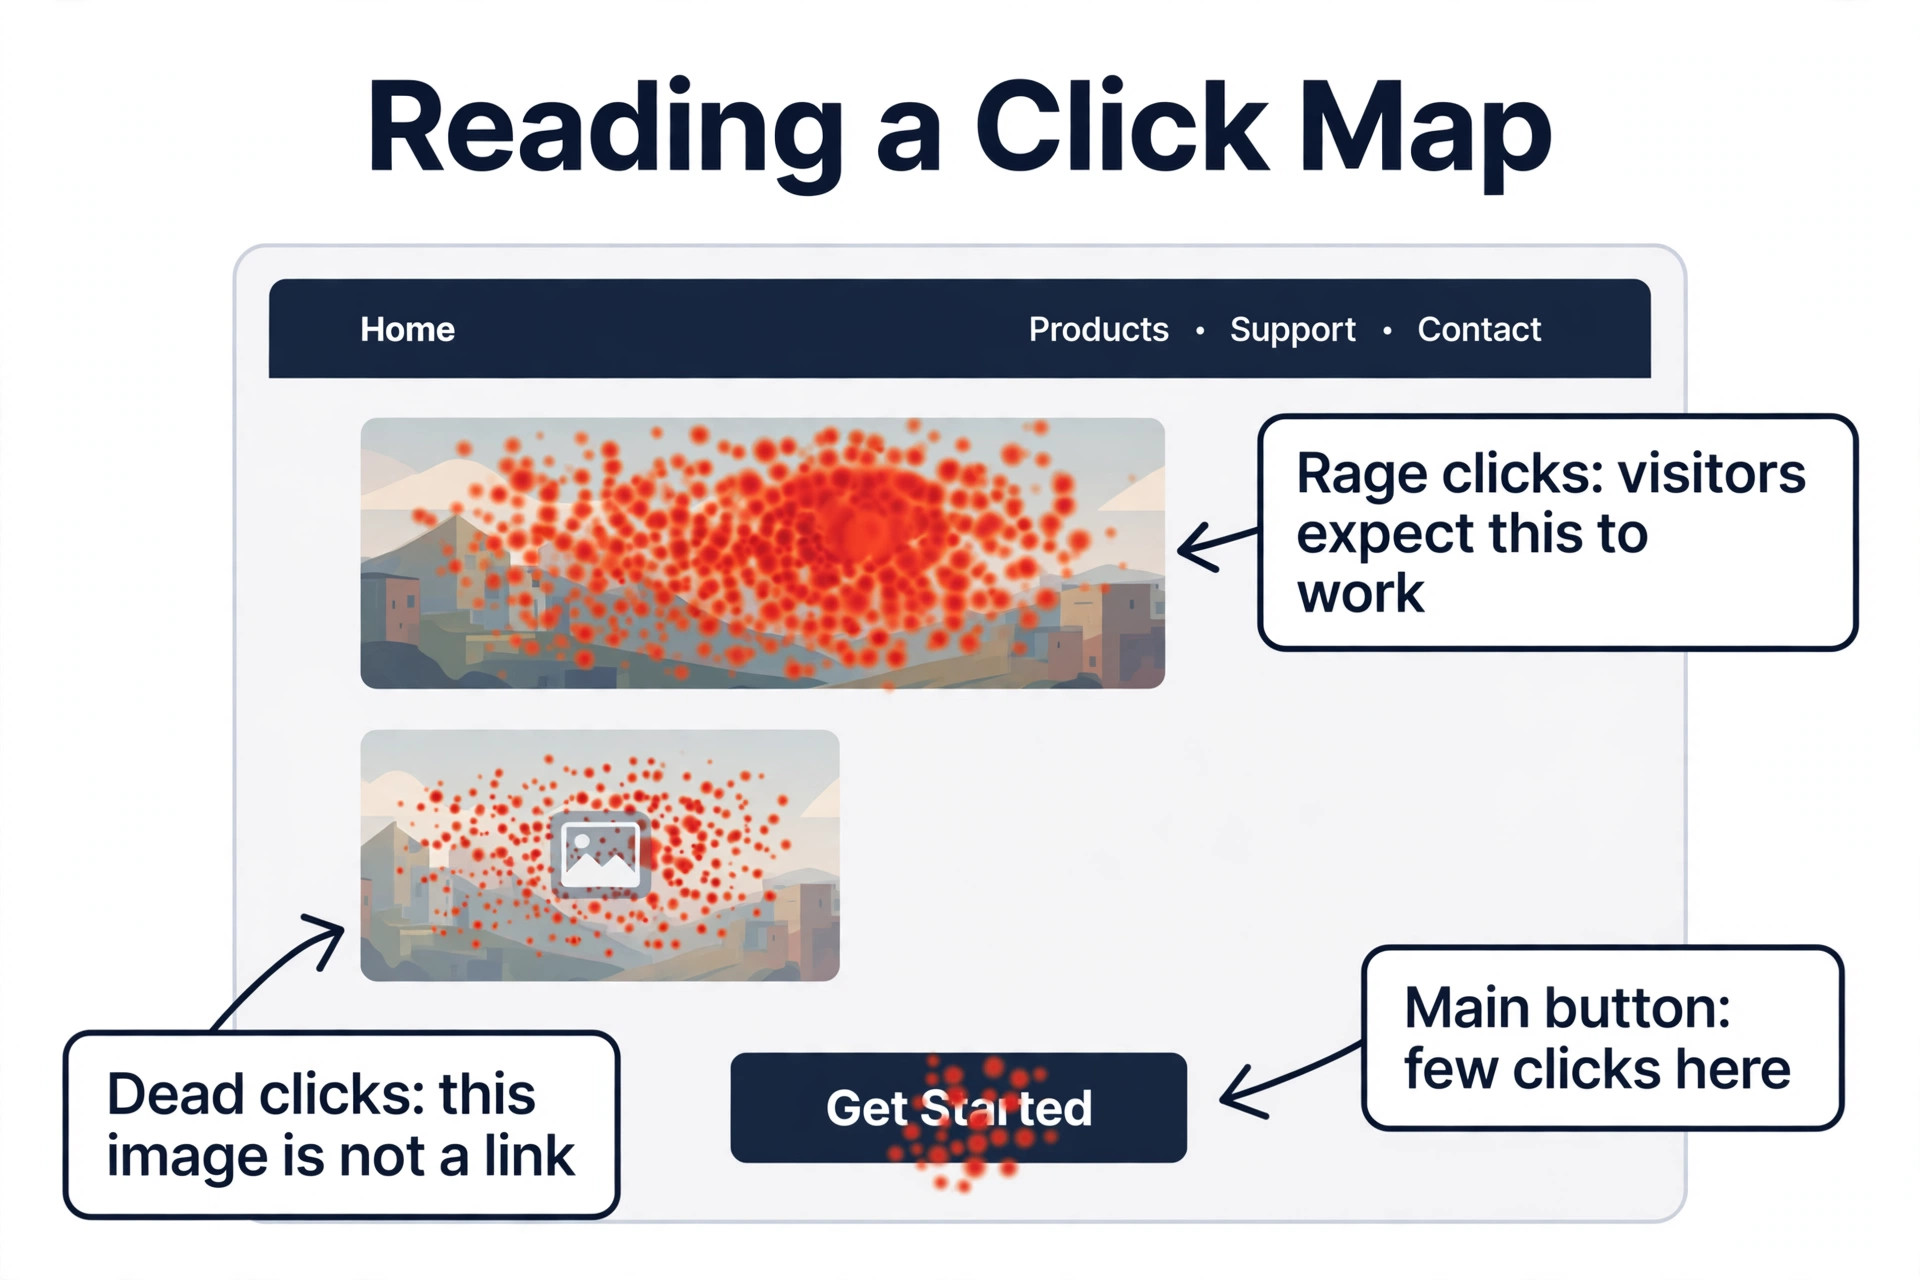
The most valuable signal is the rage click, because it is the clearest sign of frustration. A visitor who clicks the same element three times is not confused, they are annoyed, and an annoyed visitor leaves. Fix rage clicks before you fix anything else. The second most valuable signal is the form exit, because a visitor who started a form was already a lead, and the field that stopped them is the leak in your pipeline.
The Fix Checklist for Your Top Pages
Work through this checklist on the homepage and the top service page, and tick each item only when the heatmap proves it is fixed rather than when the change is live.
- The phone number and the main contact button are visible on a phone without scrolling.
- The main button looks like a button, with a colour that stands apart from the page.
- The price, or the starting price, appears before the visitor has to scroll on the pricing page.
- Every image that gets clicks is a link to the page the visitor expects.
- The form asks for no more than three fields on the first step.
- The headline states the offer in plain words, not a slogan.
- Testimonials sit above the point where the scroll map shows the steepest drop off.
- The navigation labels name the service, not the department, so a visitor can find it.
- The call to action repeats at the bottom of the page for the visitors who do scroll that far.
- The page loads fast enough that the heatmap records real behaviour rather than abandonment during loading.
Run this checklist every quarter, because pages drift. A new section gets added, a button moves, a form gains a field, and the heatmap quietly gets worse.
The Tools That Fit a Small Site
A small business does not need an enterprise experience analytics suite. A good small business website heatmap strategy needs a tool that installs in minutes, records enough sessions for free or cheap, and shows click, scroll and recording views without a training course. The tools below are ordered by value for a small site, not by size of the vendor.
Microsoft Clarity
Microsoft Clarity is the default starting point, because it is free with no paid tier and no session cap. It records unlimited sessions, gives unlimited click, scroll and area heatmaps across unlimited websites on one account, and adds an AI Copilot that answers plain language questions about the data. In April 2026 it added AI generated heatmap summaries that surface rage clicks, dead clicks and scroll drop off zones without a human having to watch every recording.
The trade off is data ownership and depth. Microsoft may use aggregated or anonymised behavioural data for its own purposes, and Clarity has no on site survey or feedback widget layer. Recordings are typically retained only about 30 days. For a small business that wants to see where visitors click, scroll and get stuck without spending anything, Clarity is the strongest default choice.
Hotjar
Hotjar is the most recognizable name in visual behaviour analytics, and it pairs heatmaps and recordings with the tools that explain behaviour, which are on page surveys, feedback widgets, user interviews and conversion funnels. That qualitative layer is what Clarity lacks, and it is the reason to pay. A survey that asks a visitor why they are leaving is worth more than a hundred recordings of visitors leaving silently.
Hotjar merged into Contentsquare on July 1, 2025, and its pricing page now redirects there. The free plan gives up to 200,000 sessions a month at zero cost, and paid plans start from roughly 32 dollars a month depending on session volume, with 365 day data retention on all plans. Choose Hotjar when you need to ask visitors questions as well as watch their behaviour.
Mouseflow
Mouseflow is the best overall paid pick for a small site, because it pairs the most complete free plan in the category with the cheapest paid tier. The free plan gives 500 sessions a month with full session replay, heatmaps and form analytics and no card required, and Essential costs 25 dollars a month billed annually for 5,000 sessions, one website, one funnel and three months of retention. Advanced costs 109 dollars a month for 25,000 sessions, and Premium costs 319 dollars for 100,000 sessions.
Mouseflow records six heatmap types, which are click, scroll, movement, attention, geography and live, and its form analytics pinpoint the exact field where visitors abandon a form. That is the reason to choose it over Clarity when your contact page is the problem. The weakness is the session ladder, because the price climbs fast once you pass 5,000 sessions a month.
Lucky Orange
Lucky Orange is the best pick for a Shopify store or a small ecommerce site that wants live chat in the same tool. It starts at 32 dollars a month billed annually for 3,500 sessions, with every feature on every plan, including heatmaps, recordings, funnels, surveys and live chat, and extra sites cost 5 dollars each. The live visitor view lets you watch a visitor and chat with them while they are still on the site, which is a feature no other tool on this list offers on the entry plan.
The weakness is the session count. At 3,500 sessions for 32 dollars, Lucky Orange costs more per session than Mouseflow, and there is no free tier, only a 7 day trial. It earns its price when the live chat turns a confused visitor into a sale. If you do not answer chat, pick Mouseflow or Clarity instead.
Crazy Egg
Crazy Egg is one of the oldest names in heatmaps, and it still works well for a simple question, which is where people click. The Starter plan costs 29 dollars a month billed annually for 5,000 tracked pageviews, 5 snapshot reports and 50 recordings, with Plus at 99 dollars for 150,000 pageviews and 1,000 recordings, Pro at 249 dollars and Enterprise at 599 dollars. It offers snapshots, confetti reports that segment clicks by traffic source, and A/B testing from the Plus plan upward.
The weakness is the metering. Crazy Egg counts pageviews rather than sessions, which buys less real traffic coverage at the same price, and the Starter plan is thin, with only 5 heatmap reports and 50 recordings. For a small business that needs recordings and form analytics, Mouseflow gives more for the same money.
Plerdy
Plerdy is the all in one pick, because it combines heatmaps, session replay, funnels, pop ups, A/B testing and an SEO audit in one subscription. The free plan covers 100 heatmaps a day, 500 video sessions and 5,000 SEO audits, and paid plans start at 21 dollars a month billed annually on Startup, with Scale at 42 dollars and Thrive at 70 dollars. That makes it the cheapest paid tool on this list for a business that wants CRO, UX and SEO in one place.
The weakness is focus. Plerdy does many jobs well and none of them as deeply as a specialist. It suits a marketing team that wants one script and one bill for heatmaps, pop ups and basic SEO checks.
Heap
Heap is the product analytics pick, and it suits a growing team that wants automatic event capture rather than manual tagging. It records every click, form submission and pageview automatically, then lets you build funnels and retention reports from the data without going back to add tracking. That saves weeks of setup for a team that does not have a developer to tag every button.
The weakness is price and complexity. The free tier is limited, paid plans typically run into the low hundreds to over 1,000 dollars a month, and the setup is heavier than Clarity or Mouseflow. Heap is the wrong tool for a brochure site with five pages. It is the right tool for a SaaS product where the behaviour inside the product matters more than the behaviour on the marketing pages.
LogRocket
LogRocket is the engineering pick, and it is built for teams that need to debug rather than to market. It captures console logs, network requests and JavaScript errors alongside the session replay, so a developer can see exactly what broke when a visitor hit an error. The free plan covers around 1,000 sessions a month, and paid plans run roughly 69 to 99 dollars a month for about 10,000 sessions.
The weakness for a small business is that LogRocket is not a marketing tool. It has no surveys, no form analytics and no heatmap depth to match Mouseflow. A small business with no developer on staff will pay for features nobody opens.
FullStory
FullStory is the enterprise session replay platform, and it records every session with deep search, frustration signals and journey analysis. It suits a larger team that wants to search across thousands of sessions for a specific pattern, like every visitor who rage clicked on the pricing page in the last month, and then watch those sessions in a row. That search power is its main advantage over the simpler tools.
The weakness is price and fit. FullStory is quote based for most teams, and its cost and complexity put it out of reach for a small business site. A small business that starts on Clarity and outgrows it should test Mouseflow or Hotjar next, not FullStory.
VWO
VWO, formerly Visual Website Optimizer, combines heatmaps and session recordings with A/B testing and personalization in one platform. It suits a business that has already fixed the obvious problems and now wants to test two versions of a page against each other, because the heatmap tells you what to test and the testing tool runs the experiment. That combination is powerful once the basics are fixed.
The weakness is that VWO is a testing platform first and a heatmap tool second, and its pricing is quote based. A small business that has not yet fixed the rage clicks and the form exits should not buy a testing tool. Fix the obvious problems with Clarity or Mouseflow first.
What to Fix First on a Typical Small Business Site
The order matters more than the number of fixes, and that order is the part of a small business website heatmap strategy most owners skip. The first fix should pay for the tool and the second fix should pay for the time. Start with the phone number and the main button on mobile, because most small business traffic is mobile and most small business sites hide the contact details below the fold. A button that is visible without scrolling and a phone number that can be tapped will earn more leads than any other single change, and the heatmap will prove it within two weeks.
Fix the form next. Cut the fields to three, make the phone number optional, and put the submit button where the scroll map shows visitors actually reach. A form that loses 40 percent of visitors at one field is a leak worth more than a new page of content. Then fix the price placement, because a visitor who cannot find the price leaves.
Fix the navigation last, because it is the slowest change and the hardest to measure. Simplify the labels, remove the items nobody clicks, and make the service pages one click from the homepage. When all four fixes are live, run the heatmap again for two weeks and compare the scroll depth and the click rate on the main button.
Mistakes That Waste the Data
The most common mistake is reading a heatmap built on too little data. A map built on 200 visitors will show a hot spot that disappears the next week, and a fix built on it will chase noise. Wait for 1,000 pageviews, wait two weeks, and segment mobile from desktop before you change anything. Patience is the cheapest part of this strategy and the part most owners skip.
The second mistake is fixing five things at once. A page that gets a new headline, a new button, a shorter form and a moved price in one week cannot tell you which change worked. Change one thing, measure for two weeks, and then change the next.
The third mistake is watching the wrong pages. A blog post that gets 2,000 readers and no leads is not the problem, and a heatmap on it will not find a lead. The homepage, the service page and the contact page are the pages that make money, and the heatmap budget should go there first.
The fourth mistake is ignoring the recordings. A heatmap shows the pattern and a recording shows the person, and the person is where the fix lives. Watch 20 recordings a month, even when the maps look healthy, because the recordings show the hesitation and the confusion that a colour map smooths away.
- Collect at least 1,000 pageviews per page before acting on a heatmap.
- Segment mobile and desktop before judging any map.
- Fix one thing at a time and measure for two weeks.
- Watch 20 session recordings a month on your busiest page.
- Re run the fix checklist every quarter, because pages drift.
Our Verdict
Start with Microsoft Clarity, because it costs nothing, records unlimited sessions and shows you the click, scroll and recording views that make a small business website heatmap strategy work. Add Hotjar when you need to ask visitors why they leave. Move to Mouseflow at 25 dollars a month when the form analytics start to matter, and test Lucky Orange when live chat is part of how you sell.
Do not buy an enterprise tool for a five page site, and do not pay for a testing platform before you have fixed the rage clicks and the form exits. The strategy is the same whatever the tool, which is to watch the pages that make money, read the scroll map first, fix one thing at a time, and measure for two weeks.
Frequently Asked Questions
What is a website heatmap?
A website heatmap is a visual report that shows where visitors click, how far they scroll and where their mouse moves on a page, using colour to mark the busiest areas. A click map shows what people try to use, a scroll map shows how far down the page they get, and a move map shows where attention goes. Session recordings sit alongside the maps and show individual visitors using the page. Together they explain the behaviour behind the traffic numbers.
How much traffic do I need before a heatmap is useful?
Collect at least 1,000 pageviews on a page before you act on its heatmap, and 2,000 if the page is a product or service page with real money behind it. Let the tool run for two full weeks so the data covers weekdays and weekends, and segment mobile from desktop before you judge the map. Microsoft Clarity has no session cap, which makes it the easiest tool for a small site to reach a trustworthy sample.
Which heatmap tool is best for a small business?
Microsoft Clarity is the best starting point for a small business website heatmap strategy, because it is free with unlimited sessions, unlimited heatmaps and recordings, and it now adds AI generated heatmap summaries. Hotjar is the best paid step up, because it adds surveys, feedback widgets and funnels from roughly 32 dollars a month, with a free plan that gives up to 200,000 sessions a month. Mouseflow is the best paid pick for form analytics at 25 dollars a month. The right tool depends on whether you need surveys, form analytics or just the maps, and most small businesses should start free and only pay when they hit a limit they can name.
How do I read a scroll map?
Read a scroll map from the top down and look for the point where the drop off is steepest. That point is where the page stopped earning attention, and the fix belongs just above it, in the headline or the offer, not below it. If 80 percent of visitors never reach the testimonials, the problem is placement, so move them up. Compare the mobile and desktop scroll maps separately.
What is a rage click and why does it matter?
A rage click is a pattern where a visitor clicks the same element several times in quick succession, usually because they expect it to work and it does not. It is the clearest sign of frustration in a session recording, and a frustrated visitor leaves and rarely comes back. Fix rage clicks before anything else, by making the element a link or a button, or by removing it.
Should I use heatmaps or A/B testing first?
Use heatmaps first, because a heatmap tells you what is broken and an A/B test tells you which of two versions is better. Testing two versions of a page that has a dead button and a hidden price will tell you which broken version is less broken. Fix the rage clicks, the form exits and the hidden price first, and then use A/B testing to compare the good version against a better one.
A small business website heatmap strategy is not a project with an end date. It is a routine that takes two hours a month, and it pays for itself every time it finds a button that nobody clicks or a form field that stops a lead. Start free with Clarity, watch 20 recordings, fix one thing, and measure for two weeks. The traffic you already have is enough to grow on, once you can see what it does.