The human brain can identify an image it has seen for as little as 13 milliseconds, according to research from MIT. That speed explains why infographics keep winning attention in feeds, reports and pitch decks where plain text gets skimmed and forgotten. A good infographic turns a dense page of numbers into a picture a reader understands in seconds, and the best infographic makers make that job possible without a design degree or a week of work. This guide compares 13 tools that do it well in 2026, with real prices, honest limits and a clear pick for each kind of job.
How the Best Infographic Makers Were Scored
Every tool below was judged on the same five measures, because a tool that shines for a marketer can fail a data analyst, and the reverse is just as true. Template quality came first. A strong library means starting from a layout that already works, not from a blank page. Data handling came second. The best infographic makers let you paste numbers, connect a spreadsheet or import a CSV and turn it into a chart without retyping anything.
Ease of use came third, because a tool that takes a day to learn will not get used twice. Export quality came fourth. Free plans that watermark or block high resolution downloads are honest limits, and they count. Price came fifth, measured as the cheapest paid plan that removes the main limits. AI features were treated as a bonus, not a deciding factor, because an AI draft still needs a human to check every number it prints.
The 13 Best Infographic Makers at a Glance
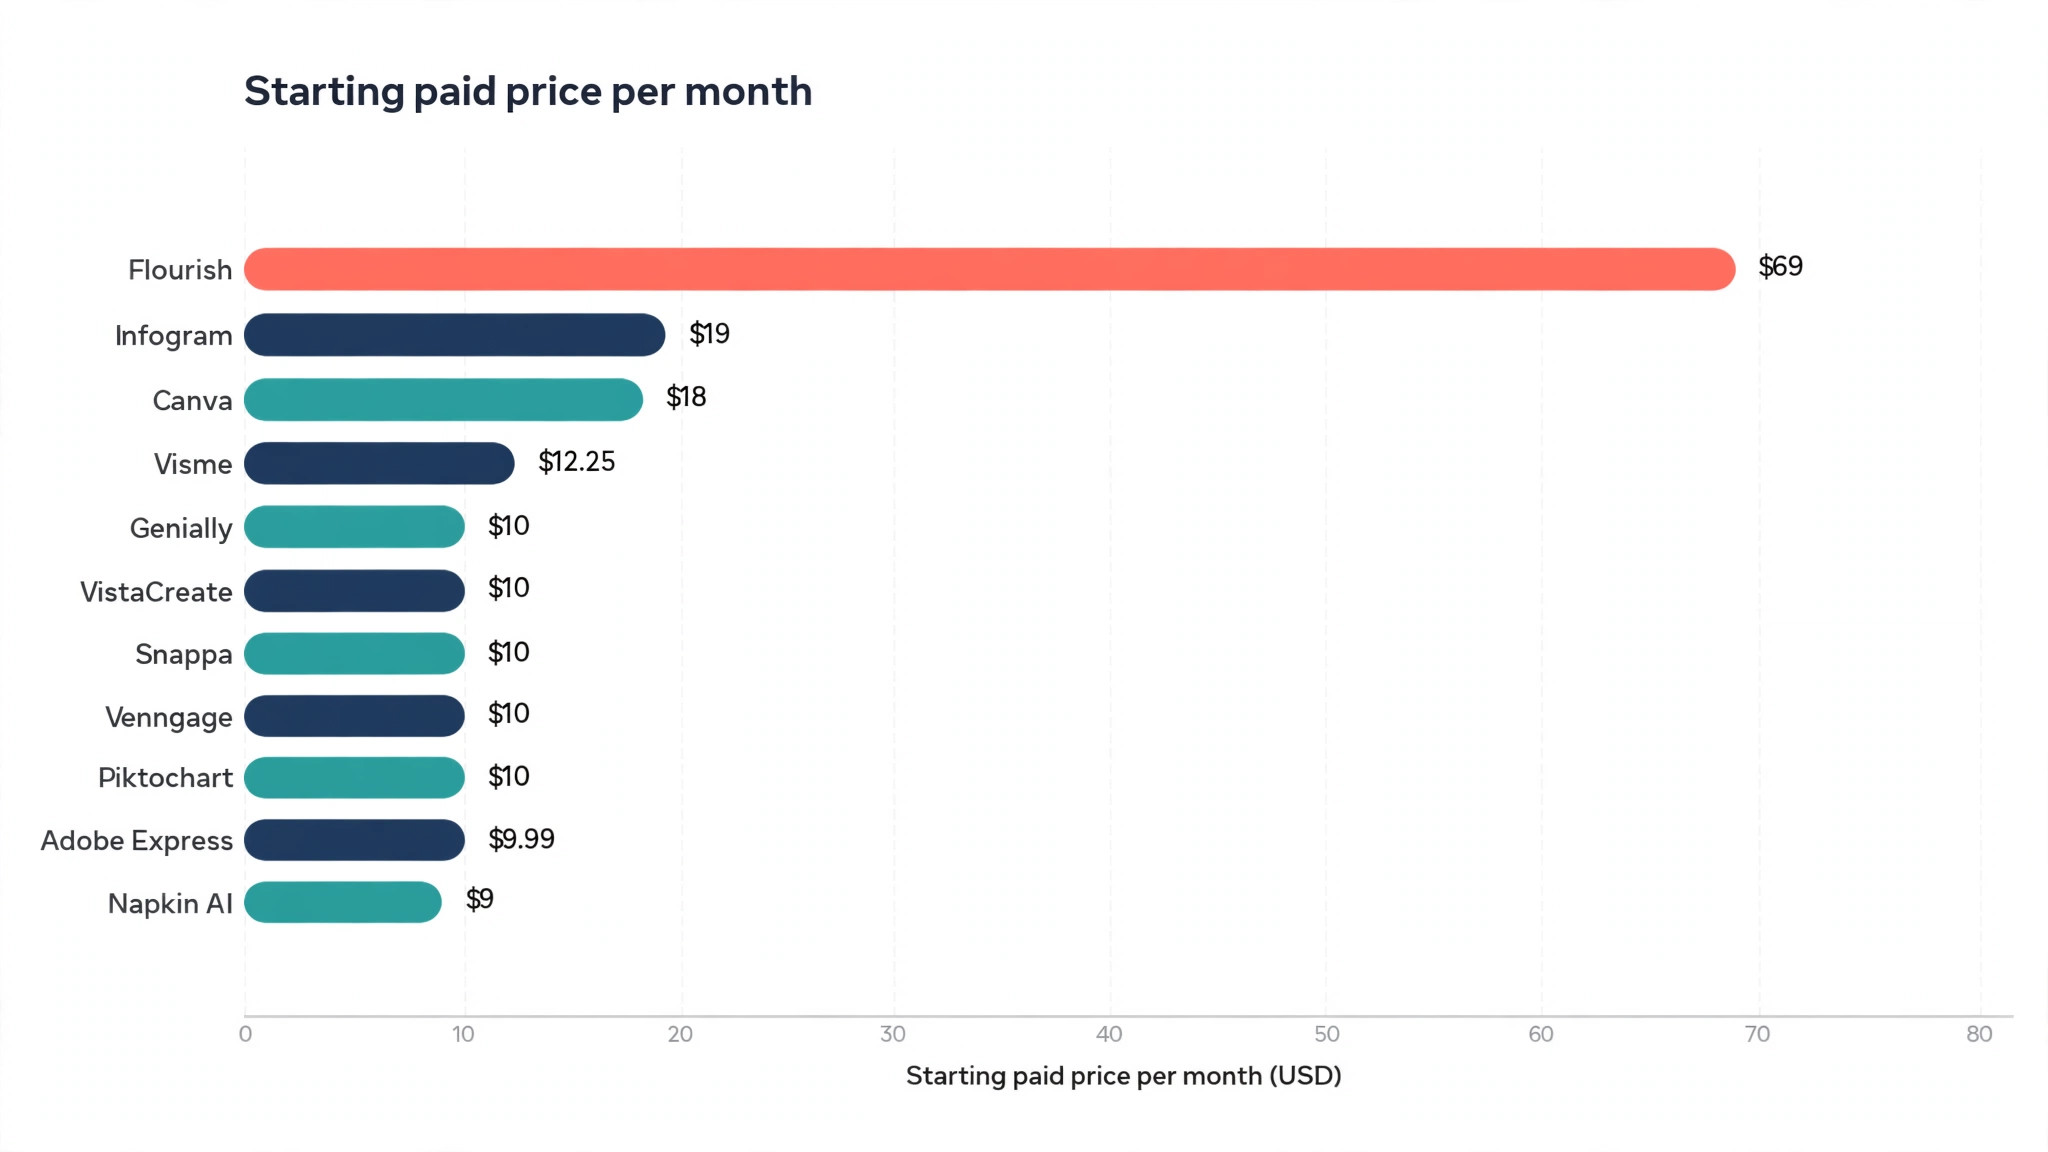
| Tool | Best for | Free plan | Paid from | Standout strength |
|---|---|---|---|---|
| Canva | Everyday infographics for non-designers | Yes | $18 a month | Largest template library |
| Piktochart | Data-led business infographics | Yes | $10 a month | Guided layouts and AI drafts |
| Venngage | Professional business reports | Yes | $10 a month | Brand and accessibility tools |
| Visme | Interactive and animated visuals | Yes | $12.25 a month | Animation and interactivity |
| Infogram | Charts, maps and dashboards | Yes | $19 a month | Live spreadsheet sync |
| Adobe Express | Fast branded graphics | Yes | $9.99 a month | Adobe Stock and Firefly AI |
| Snappa | Quick blog and social graphics | Yes | $10 a month | Fastest editor of the group |
| VistaCreate | Small teams on a budget | Yes | $10 a month | One price covers 10 seats |
| Datawrapper | Publication grade charts | Yes | Custom pricing | Precise, trustworthy charts |
| Napkin AI | Turning text into diagrams | Yes | $9 a month | Text to visual in seconds |
| Genially | Interactive presentations and visuals | Yes | $10 a month | Clickable, explorable graphics |
| Flourish | Data stories and embeds | Yes | Paid plans from $69 a month | Beautiful animated charts |
| Easel.ly | Simple classroom and team graphics | Yes | No public paid price | Easiest start of the group |
Prices shown are the cheapest paid plan on annual billing where the vendor publishes one, in US dollars. Vendors change prices often, so confirm the current figure on the vendor site before you buy.
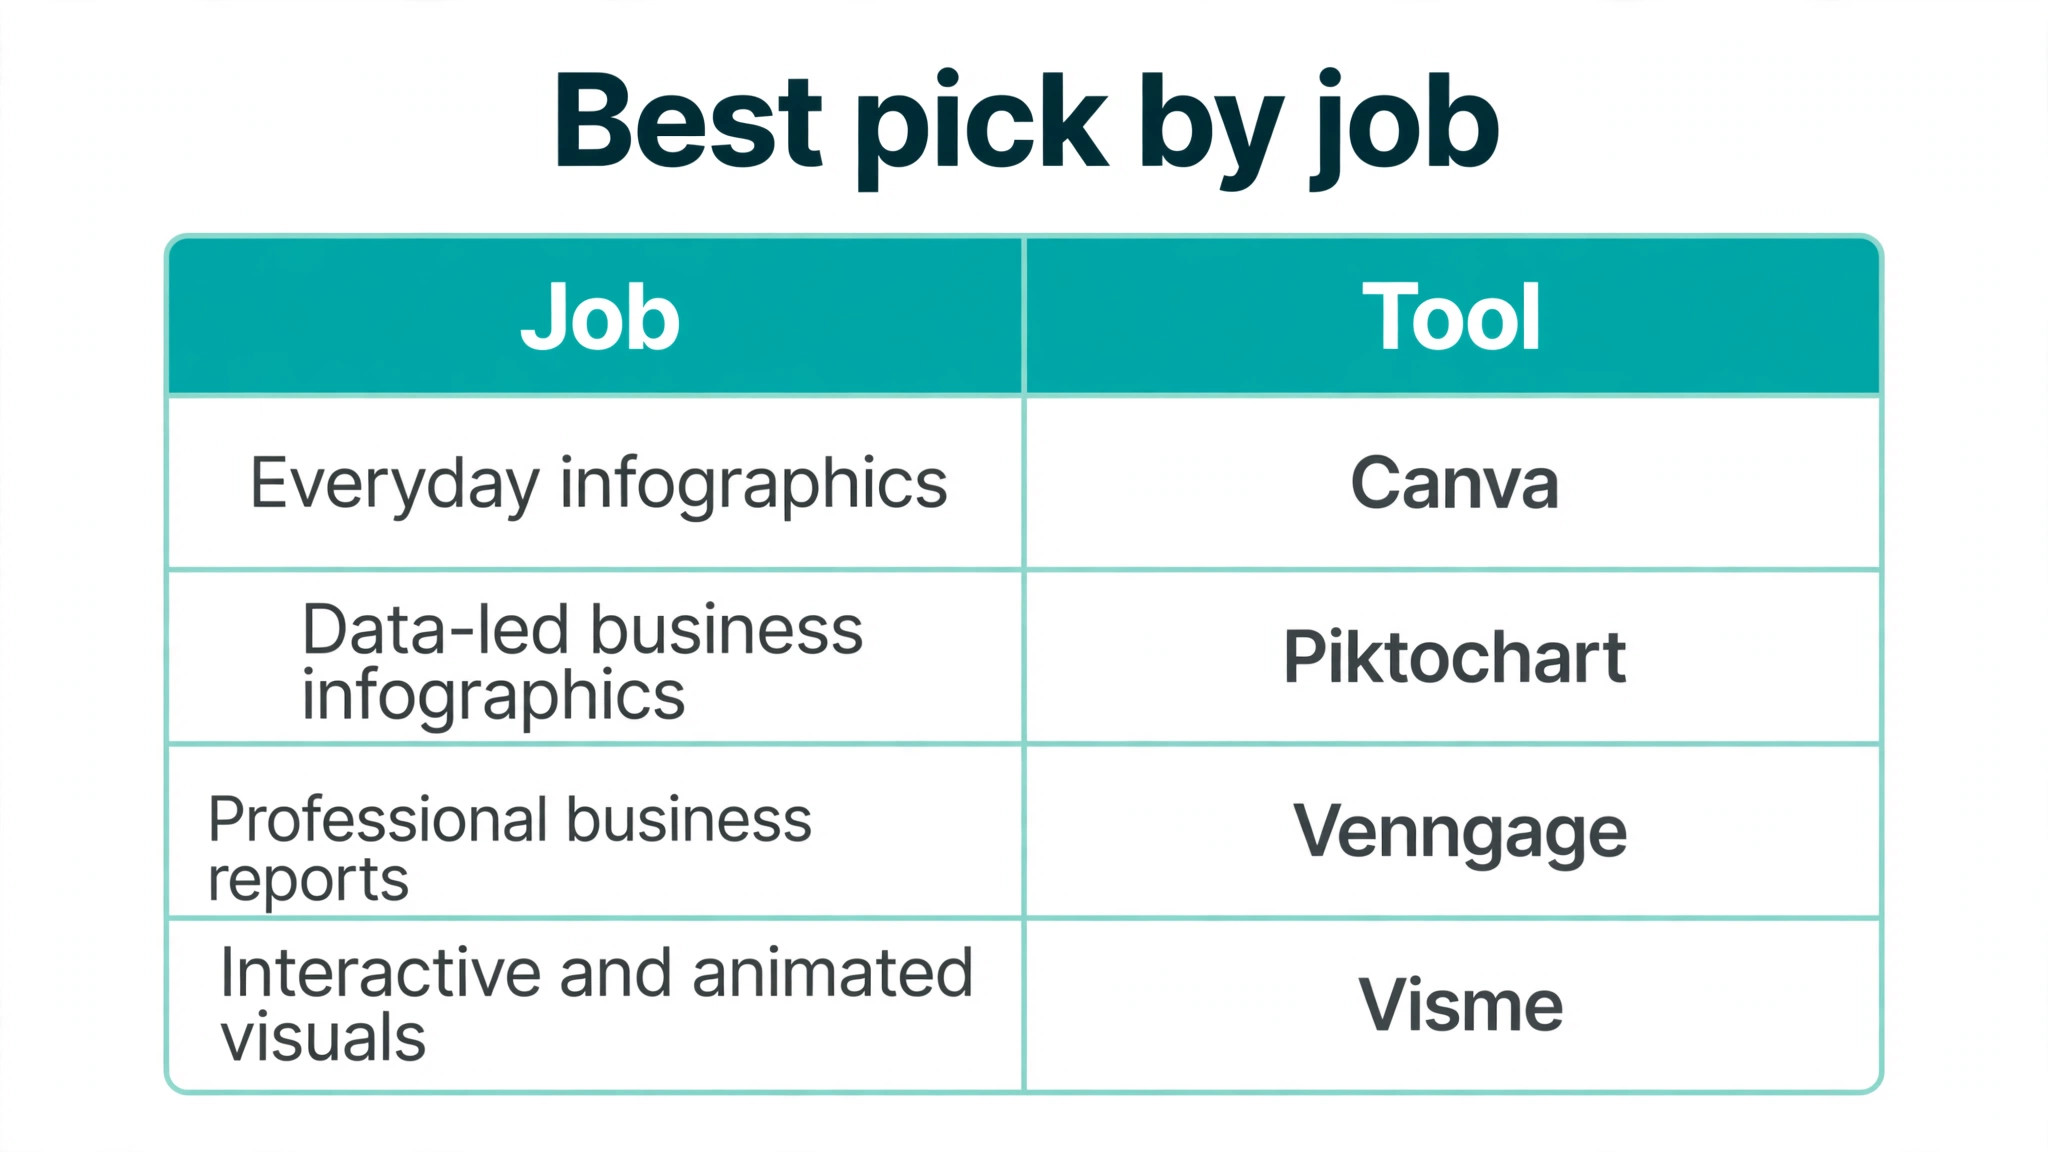
Best Pick by Job
| Job | Pick | Why it wins |
|---|---|---|
| First infographic ever | Canva | Templates and editor need no learning curve |
| Monthly business reports | Piktochart | Guided layouts keep reports consistent |
| Branded company visuals | Venngage | Brand kit and accessibility checks built in |
| Animated social graphics | Visme | Animation and interactivity in one editor |
| Data that updates itself | Infogram | Live Google Sheets sync |
| Charts for a newsroom or report | Datawrapper | Precise charts with no design noise |
| Turning a wall of text visual | Napkin AI | Paste text and get a diagram |
| A whole team on one budget | VistaCreate | Ten seats for one Pro price |
| Quick graphics inside Adobe tools | Adobe Express | Stock assets and Firefly AI included |
| Interactive content for learners | Genially | Clickable layers and quizzes |
Infographic Formats Worth Knowing
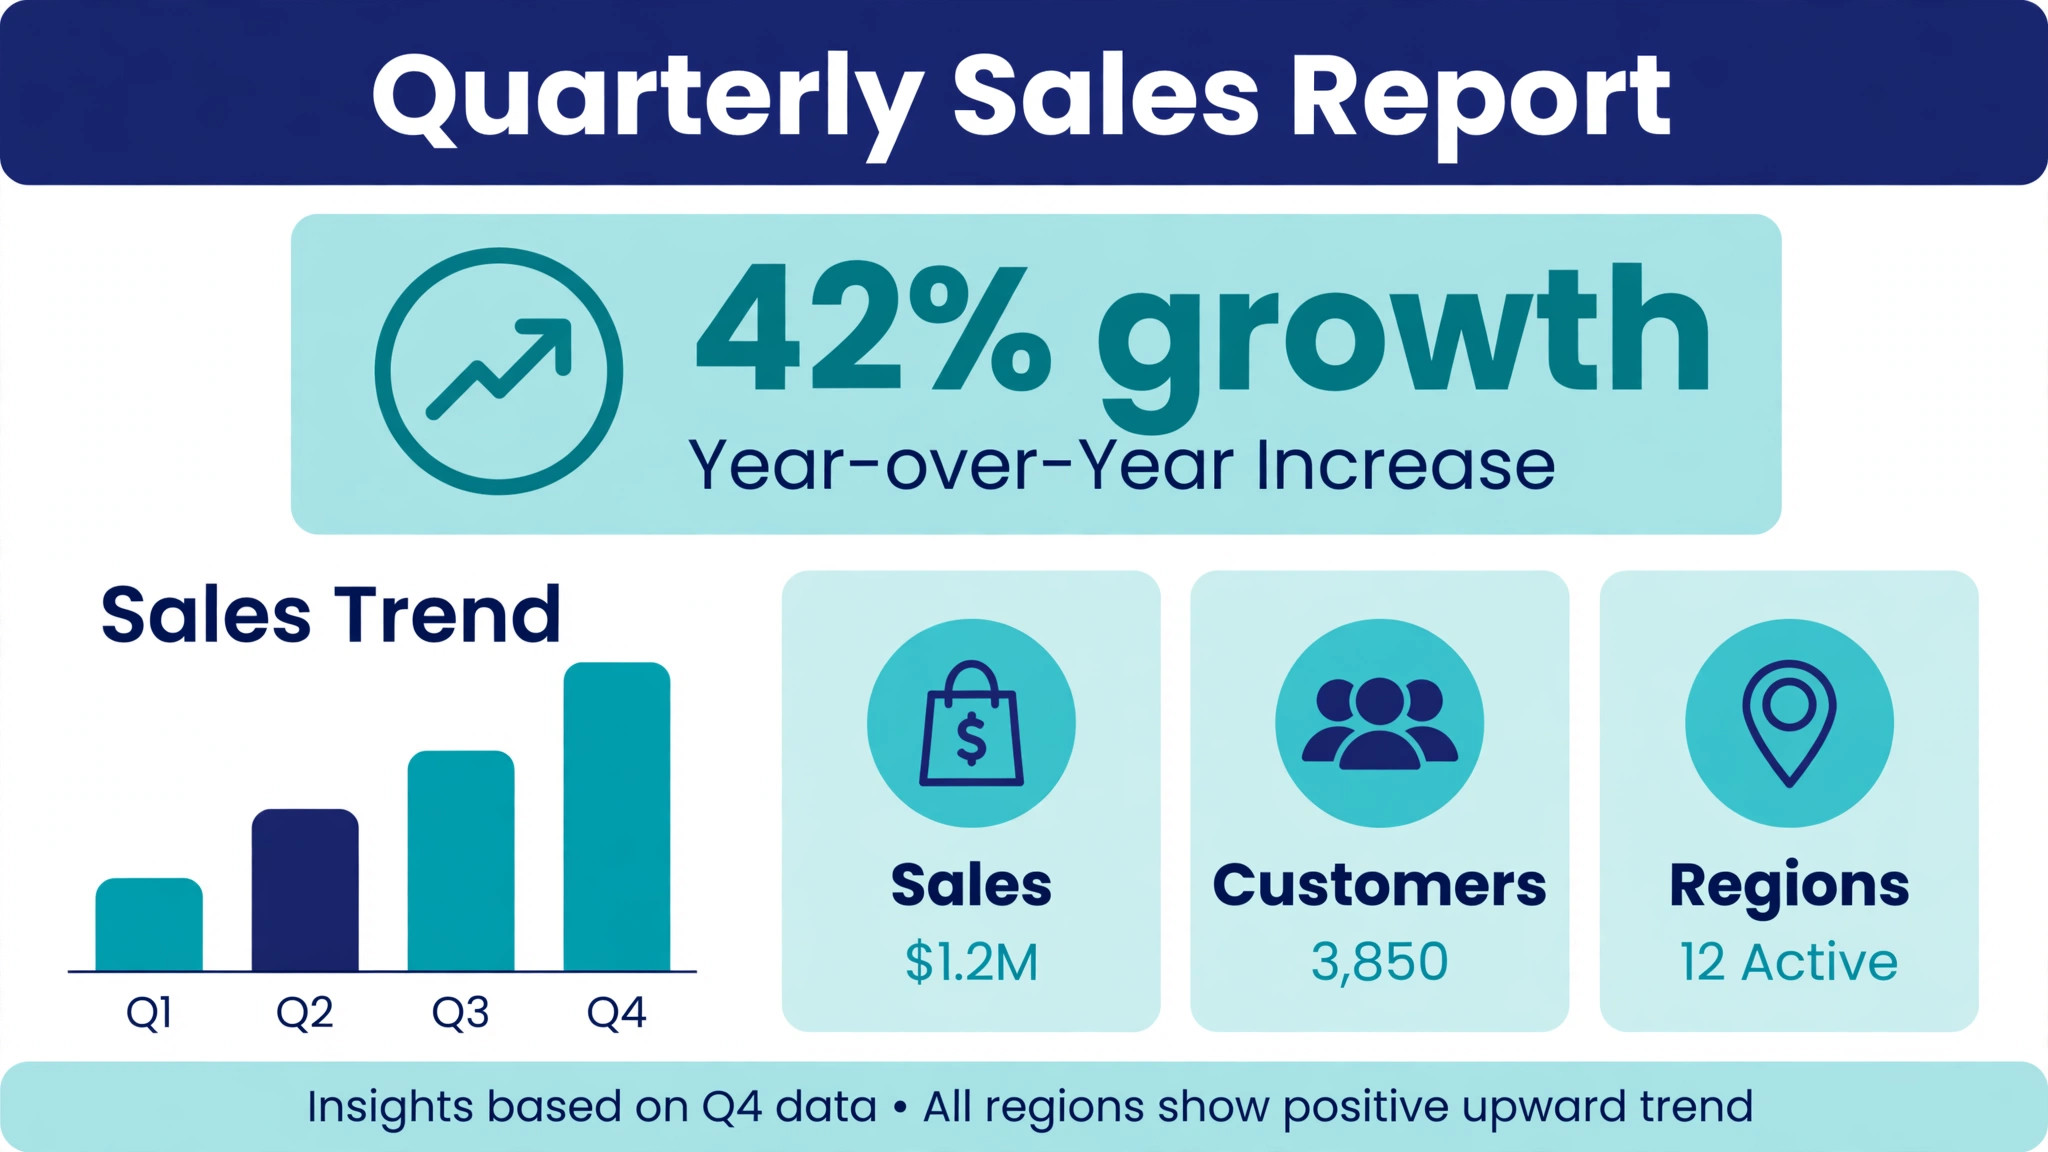
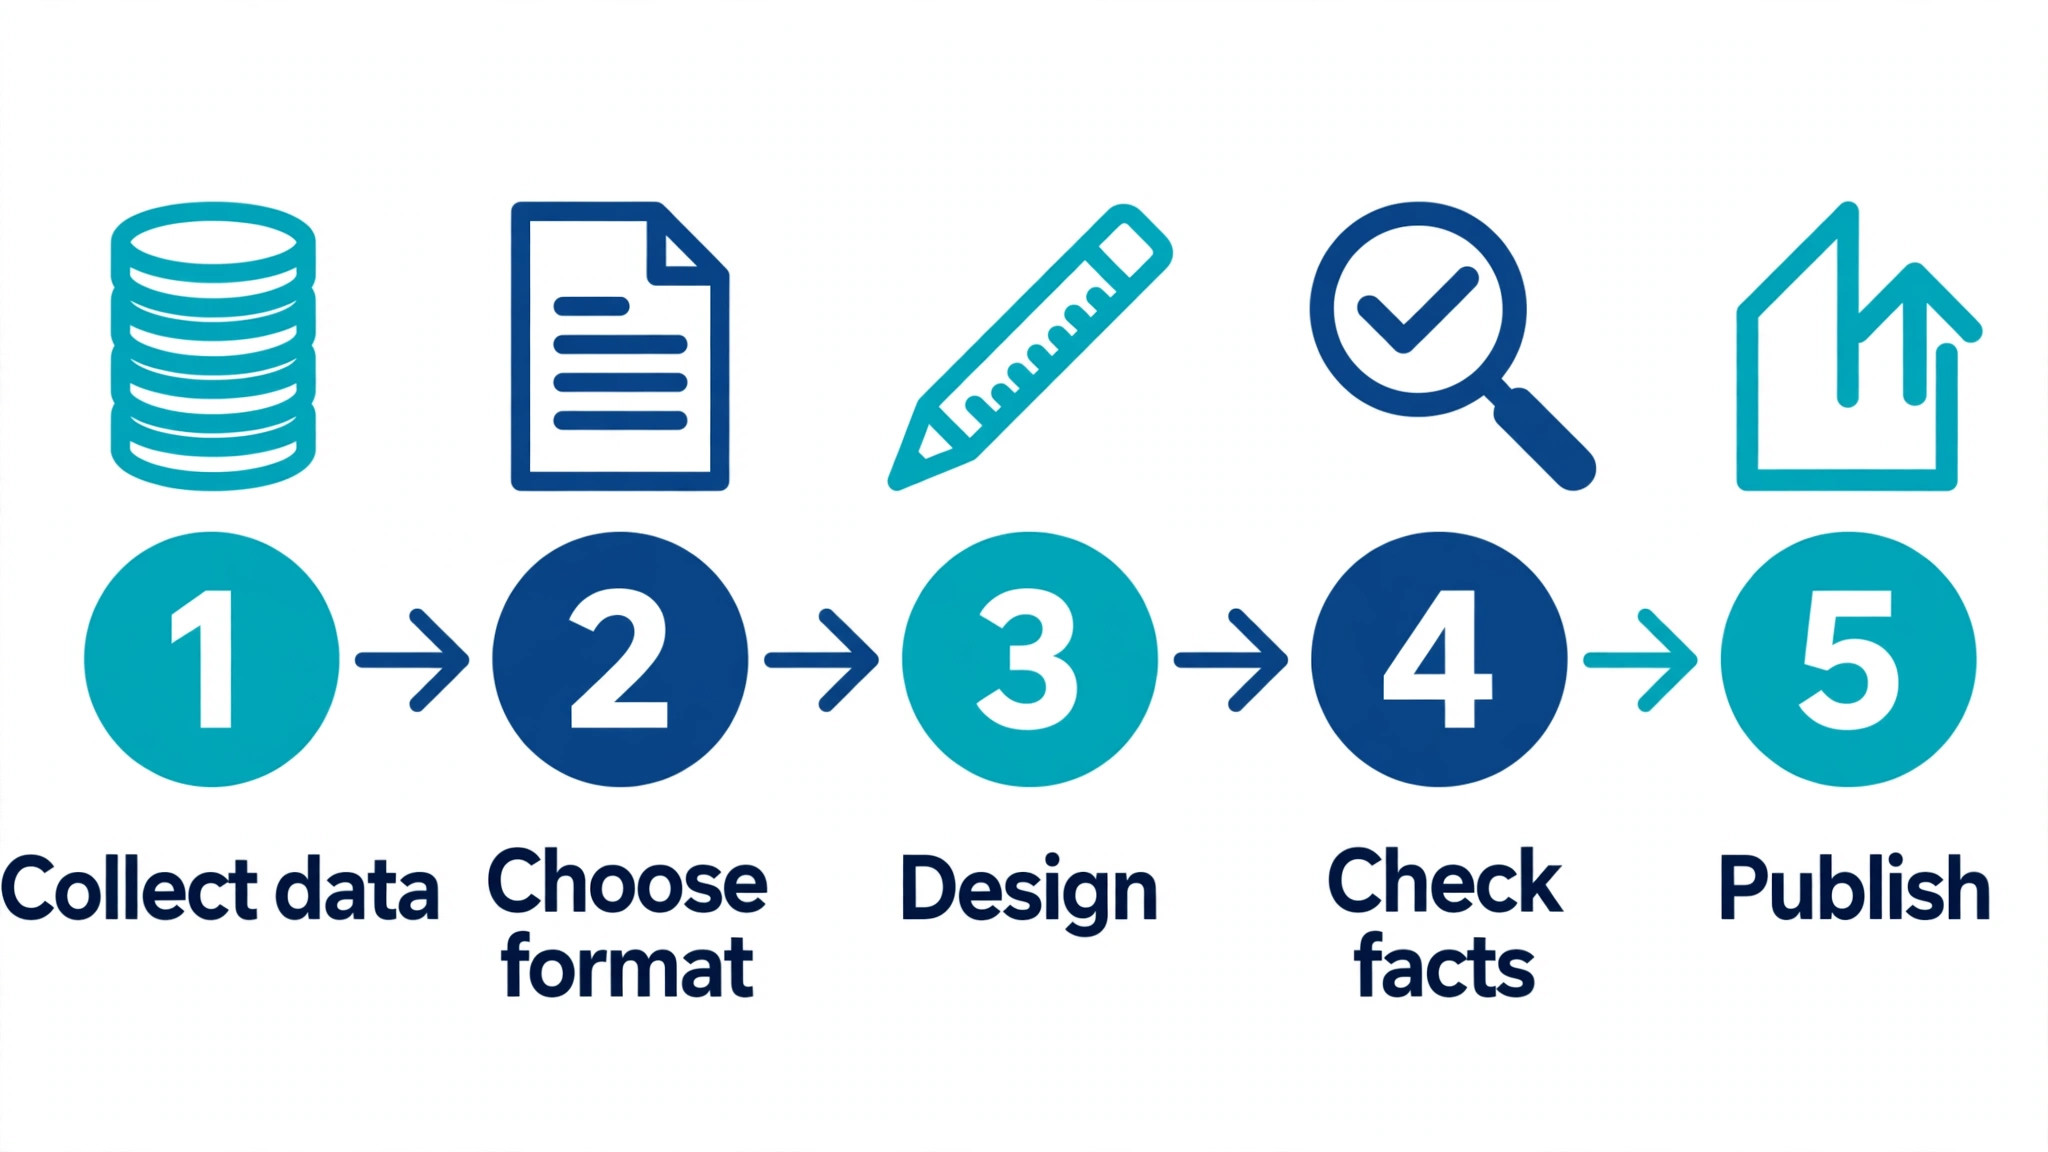
Not every infographic is a tall image. The format should match the message, and picking the wrong one is the fastest way to waste a good set of numbers. A statistical infographic leads with one big number and supports it with three or four smaller facts. It works for survey results, annual reports and any story where a single figure carries the weight. A timeline infographic lays events along a line, which suits company histories, product launches and process stories. A comparison infographic puts two options next to each other, which suits pricing, before and after results and product choices.
A process infographic breaks a workflow into numbered steps with a short line of text under each one. It works for recipes, instructions and any task a reader needs to repeat. A list infographic is the simplest format of all, a ranked or grouped set of points with icons. It works for tips, benefits and checklists.
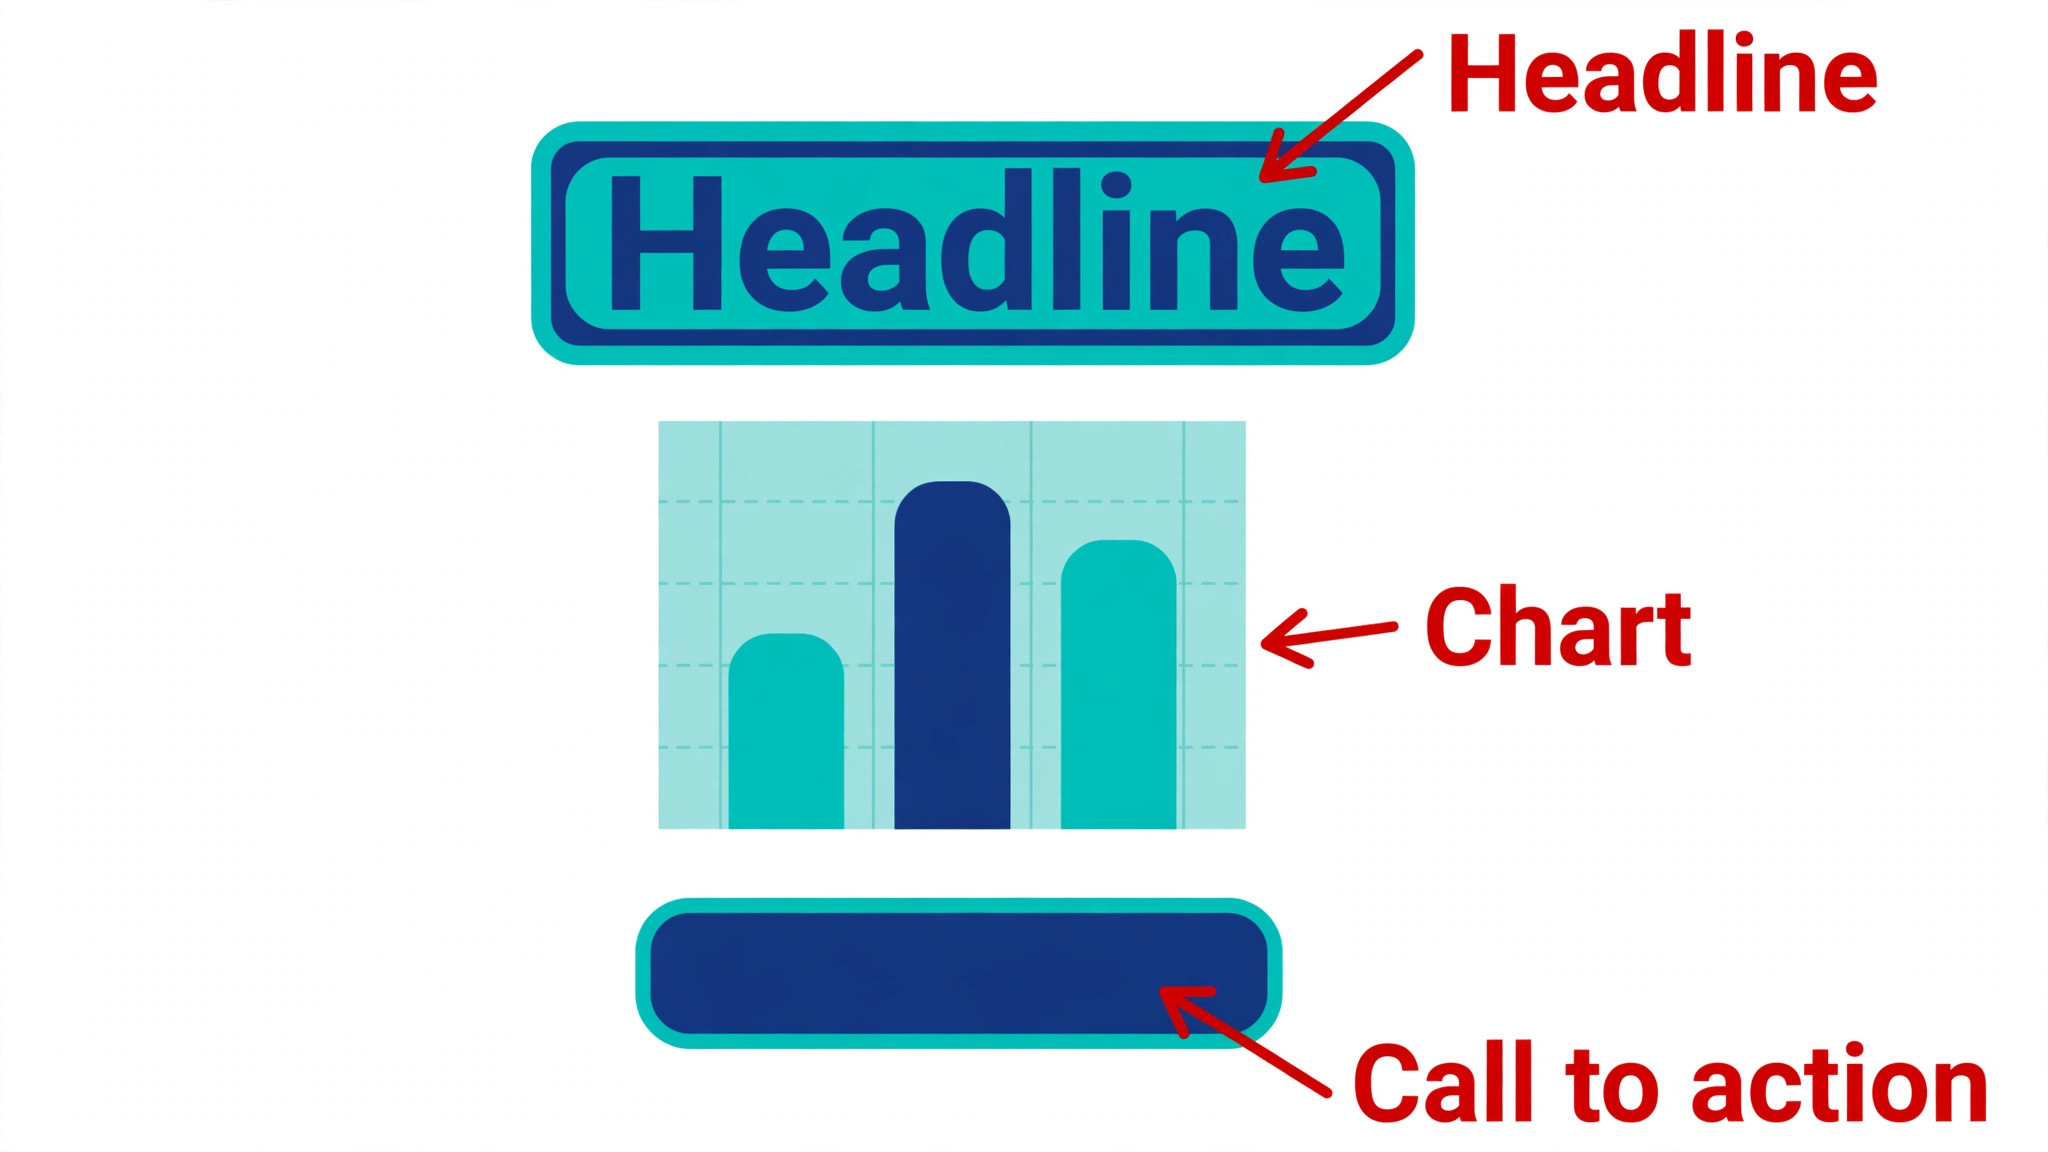
A geographic infographic uses a map to show where things happen, which suits regional data, store locations and election results. A hierarchical infographic shows a structure, such as an organisation chart or a decision tree. Most tools in this list cover all of these formats with templates, but the data tools handle statistical and geographic formats best, while the general editors handle list and process formats best.

The format also decides the shape. Tall infographics suit blog posts and Pinterest, where readers scroll. Wide infographics suit slides and reports, where the page is wide rather than tall. Square infographics suit social feeds, where a tall image gets cropped. Design the graphic at the shape where it will be seen, not the shape the template defaults to, and check the export on a phone before you publish. A graphic that looks sharp on a desktop monitor can turn into unreadable small print on a mobile screen.
Free Plans Compared
Free plans are the best way to test a tool, but they are not equal. Canva free includes a large template library, 5 GB of storage and basic charts, with premium templates and brand kit features locked. Piktochart free includes 60 AI credits a month, which is enough to generate several drafts and learn the workflow. Venngage free allows five designs and five AI generations a day, but downloads are limited, so it suits testing rather than publishing. Visme free covers basic infographics with limited templates and a Visme watermark on some exports.
Infogram free covers basic charts with a public link and Infogram branding. Adobe Express free includes 5 GB of storage, templates, a free image resize action, limited AI credits and a content scheduler. Snappa free is the tightest of the group, with only three downloads a month. VistaCreate free includes more than 100,000 templates, one brand kit and 10 GB of storage, which is generous for a free plan. Datawrapper free covers core chart types with branding. Napkin AI free covers casual diagram generation with watermarked exports. Genially free covers basic interactive content. Flourish free covers core visualisations with branding. Easel.ly free covers the core editor.
The pattern is clear. Free plans are generous for learning and for occasional use, and they get tight the moment publishing becomes regular. A blogger who makes one infographic a month can stay free for a long time. A team that publishes weekly will hit download limits, watermarks or locked templates within the first month, and at that point the cheapest paid plan is usually worth it.
The 13 Tools in Detail
1. Canva
Canva is the default pick for most people, and the reason is simple. It has the largest template library of any tool here, a free plan that stays useful for months, and an editor that a first time user understands in minutes. Infographic templates cover timelines, comparisons, processes, lists and data stories, and the drag and drop editor makes swapping colours, fonts and icons painless. Magic Design builds draft layouts from a short prompt, and the chart tool handles simple bar, line and pie charts from pasted data.
The limits show up when data gets serious. Canva has no spreadsheet sync, so a chart that changes every month must be rebuilt by hand. The free plan locks many templates and all brand kit features behind Pro. Pro costs $18 a month, or $144 a year, which is fair for a general design tool but more than a dedicated infographic app charges. Canva suits marketers, teachers, small business owners and anyone who makes one infographic a week or less and wants the rest of their design work in the same place.
2. Piktochart
Piktochart is built for one job, and it shows. Where Canva is a general design platform, Piktochart is an infographic and report tool first, with guided layouts that keep spacing, alignment and hierarchy correct even when the user has no design sense. Pikto AI turns a topic, a block of pasted text or an uploaded document into an editable draft in under a minute. The free plan includes 60 AI credits a month, which is enough to test the workflow properly.
Pro costs $10 per member a month on annual billing, or $15 month to month, which undercuts Canva Pro while offering a deeper infographic feature set. Charts link to data, maps are built in, and exports include PNG, PDF and HTML embeds. The template library is smaller than Canva, and the tool is less useful for general social graphics. Piktochart is the pick for teams that publish reports, guides and data visuals on a regular schedule.
3. Venngage
Venngage targets business users who need polished, on brand infographics without hiring a designer. Its template library leans toward reports, white papers, proposals and internal communications, and the quality of the default layouts is consistently high. The AI generator accepts prompts, documents and CSV files, and an AI design chatbot handles follow up edits in plain language. A built in accessibility checker flags contrast and readability problems before export, which matters for any organisation that publishes for the public.
The free plan allows five designs and five AI generations a day, but downloads are limited. Premium costs $10 a month on annual billing, or $19 month to month, and Business costs $24 a month on annual billing. Venngage suits communications teams, consultants and nonprofits that need professional output with brand colours locked in and accessibility checked as part of the workflow.
4. Visme
Visme is the strongest choice when an infographic needs to move or respond. It supports animation, interactive charts, clickable hotspots and embedded video, so a static image can become a small interactive experience. The template library is large, though quality varies more than the libraries at Piktochart or Venngage. AI Designer generates ready to use designs from a text prompt, and the chart tools handle data visuals with more depth than Canva.
Starter costs $12.25 a month on annual billing, while Pro costs $24.75 a month and unlocks most of the interactive and animation features. That gap matters, because the Starter plan leaves the best features behind the higher tier. Visme suits marketers who publish animated social content, trainers who build interactive guides, and teams that present data in meetings rather than in print.
5. Infogram
Infogram is the data specialist. It builds charts, maps and dashboards that stay linked to their source, so a Google Sheets update flows into the published graphic without rebuilding it. That single feature makes it the right tool for dashboards, live reports and any graphic that tracks numbers over time. Interactive charts let readers hover for exact values, filter by category and explore the data themselves.
The trade off is design range. Infogram templates are clean and professional but narrow, and the tool is not the place to build a playful social graphic. Pricing starts at $19 a month on annual billing, or $25 month to month, which makes it one of the pricier tools here. The free plan covers basic charts with a public link. Infogram suits analysts, journalists, researchers and operations teams whose infographics are really data visualisations with a title.
6. Adobe Express
Adobe Express is Adobe’s answer to Canva, and it fits naturally into any workflow that already uses Adobe tools. Premium costs $9.99 a month, or $99.99 a year, which undercuts Canva Pro while including a large Adobe Stock photo collection and Firefly AI image generation. Templates are strong, the editor is fast, and one click resizing turns one graphic into a full set of matching sizes. The free plan is genuinely useful, with 5 GB of storage and a content scheduler for one account per network.
Infographic templates exist but are fewer than the libraries at Canva or Piktochart, and the chart tools are basic. Express suits small businesses and creators who already live in the Adobe world, or anyone who wants premium stock photos and AI image generation bundled into a cheap monthly plan.
7. Snappa
Snappa is the fastest editor in this list. It loads quickly, keeps the interface simple, and gets a finished graphic out in minutes. The template library holds more than 6,000 designs, and exports include web optimised JPG, high resolution PNG and 2x retina versions. Magic resize turns one graphic into matching sizes for every channel. The free Starter plan allows only three downloads a month and no background removal, which is tight for regular use.
Pro costs $10 a month on annual billing, or $15 month to month, and the Team plan covers five users for $240 a year. Snappa does not try to be a data tool, so anyone who needs charts linked to a spreadsheet should look elsewhere. Snappa suits bloggers, marketers and small teams who value speed above depth and publish simple graphics every day.
8. VistaCreate
VistaCreate, formerly Crello, is the budget pick for small teams. Pro costs $10 a month on annual billing, or $13 month to month, and one Pro price covers up to ten team members with no per seat charge. That is rare at this price and makes it the cheapest way to give a whole team premium design tools. The free Starter plan includes more than 100,000 templates, one brand kit and 10 GB of storage, while Pro adds more than 200,000 templates, a much larger stock library, AI tools, unlimited brand kits and unlimited storage.
The infographic templates are decent but the library is built for social posts first, so data heavy work is thinner here than at Piktochart or Infogram. VistaCreate suits small businesses, startups and nonprofits that need a shared design tool for a team of up to ten without paying per person.
9. Datawrapper
Datawrapper makes charts for newsrooms, and it shows in the output. Charts are precise, clean and free of decoration, with careful defaults for labels, scales and colour that keep a graphic honest. Data can be pasted, uploaded or linked, and the tool produces charts, maps and tables that embed anywhere. The free plan covers the core chart types with Datawrapper branding. Paid plans are custom priced, so a team needs to contact sales for a quote, which is a real drawback for small buyers who want a number before they commit.
Datawrapper is not a general design tool. There are no marketing templates, no illustration library and no AI features. It suits journalists, researchers, analysts and anyone whose reputation depends on charts that are accurate first and attractive second.
10. Napkin AI
Napkin AI solves a different problem from every other tool here. It turns a block of text into a diagram, flowchart or visual summary in seconds. Paste a paragraph, pick a style, and the tool generates a visual that explains the idea. The free plan covers casual use with watermarked exports, and Pro costs $9 a month. The visuals are diagrams and conceptual graphics, not data charts, so Napkin AI will not replace a chart tool. It suits writers, teachers, consultants and founders who need to explain an idea visually and hate starting from a blank canvas.
11. Genially
Genially builds interactive content. Infographics made in Genially can include clickable layers, pop up details, embedded video and quiz elements, so a reader explores the graphic instead of scanning it once. Templates cover infographics, presentations, interactive images and learning materials. The free plan is useful for trying the format, and Pro costs $10 a month per user on annual billing.
The learning curve is steeper than Canva or Snappa, because interactivity adds decisions to every design. Static exports are weaker than the interactive versions, so Genially only makes sense when the graphic will be viewed on screen. Genially suits educators, trainers and marketers who publish interactive guides, learning modules and explorable data stories.
12. Flourish
Flourish is built for data stories. It turns spreadsheets into animated charts, maps, scatter plots and race charts that readers can play with, and the results embed cleanly in articles and reports. The free plan covers the core visualisations with Flourish branding. Paid plans start at $69 a month for the Personal plan, which is expensive for casual use but fair for a newsroom or research team that publishes data stories every week. Flourish suits journalists, analysts and content teams whose infographics are driven by a dataset that changes over time.
13. Easel.ly
Easel.ly is the simplest tool in this list, and that is its appeal. The editor is minimal, the templates are straightforward, and a first infographic takes minutes rather than an hour. It suits classrooms, community groups and small teams that need a quick visual for a meeting or a notice board. The free plan covers the core features, and Easel.ly does not publish a standard paid price on its pricing page, so anyone who needs premium features should check the site directly. The limits are real. Templates are fewer and plainer than the leaders, chart options are basic, and there is no AI generation or spreadsheet sync. Easel.ly is the pick when ease matters more than polish.
How to Choose Among the Best Infographic Makers
Start with the job, not the tool. If the graphic explains data that changes every month, pick a tool with spreadsheet sync, because rebuilding charts by hand is the cost that hurts most over a year. If the graphic is a one off social post, pick the fastest editor with the best templates, because speed matters more than data features.
If a whole team will use the tool, check the per seat price, because a cheap plan that charges per person can cost more than a pricier plan that covers ten seats. If the graphic will be printed, check export resolution and PDF support before you design anything. Print needs at least 300 DPI, and several free plans cap exports below that.
Test the free plan with a real project, not a demo. Build the exact infographic you need, export it, and look at the result on the screen where your audience will see it. Check whether the free export carries a watermark, whether the chart type you need is locked, and whether the template you liked is actually free. The best infographic makers all offer free plans, but the free plans differ sharply in what they let you finish.
Mistakes That Ruin a Good Infographic
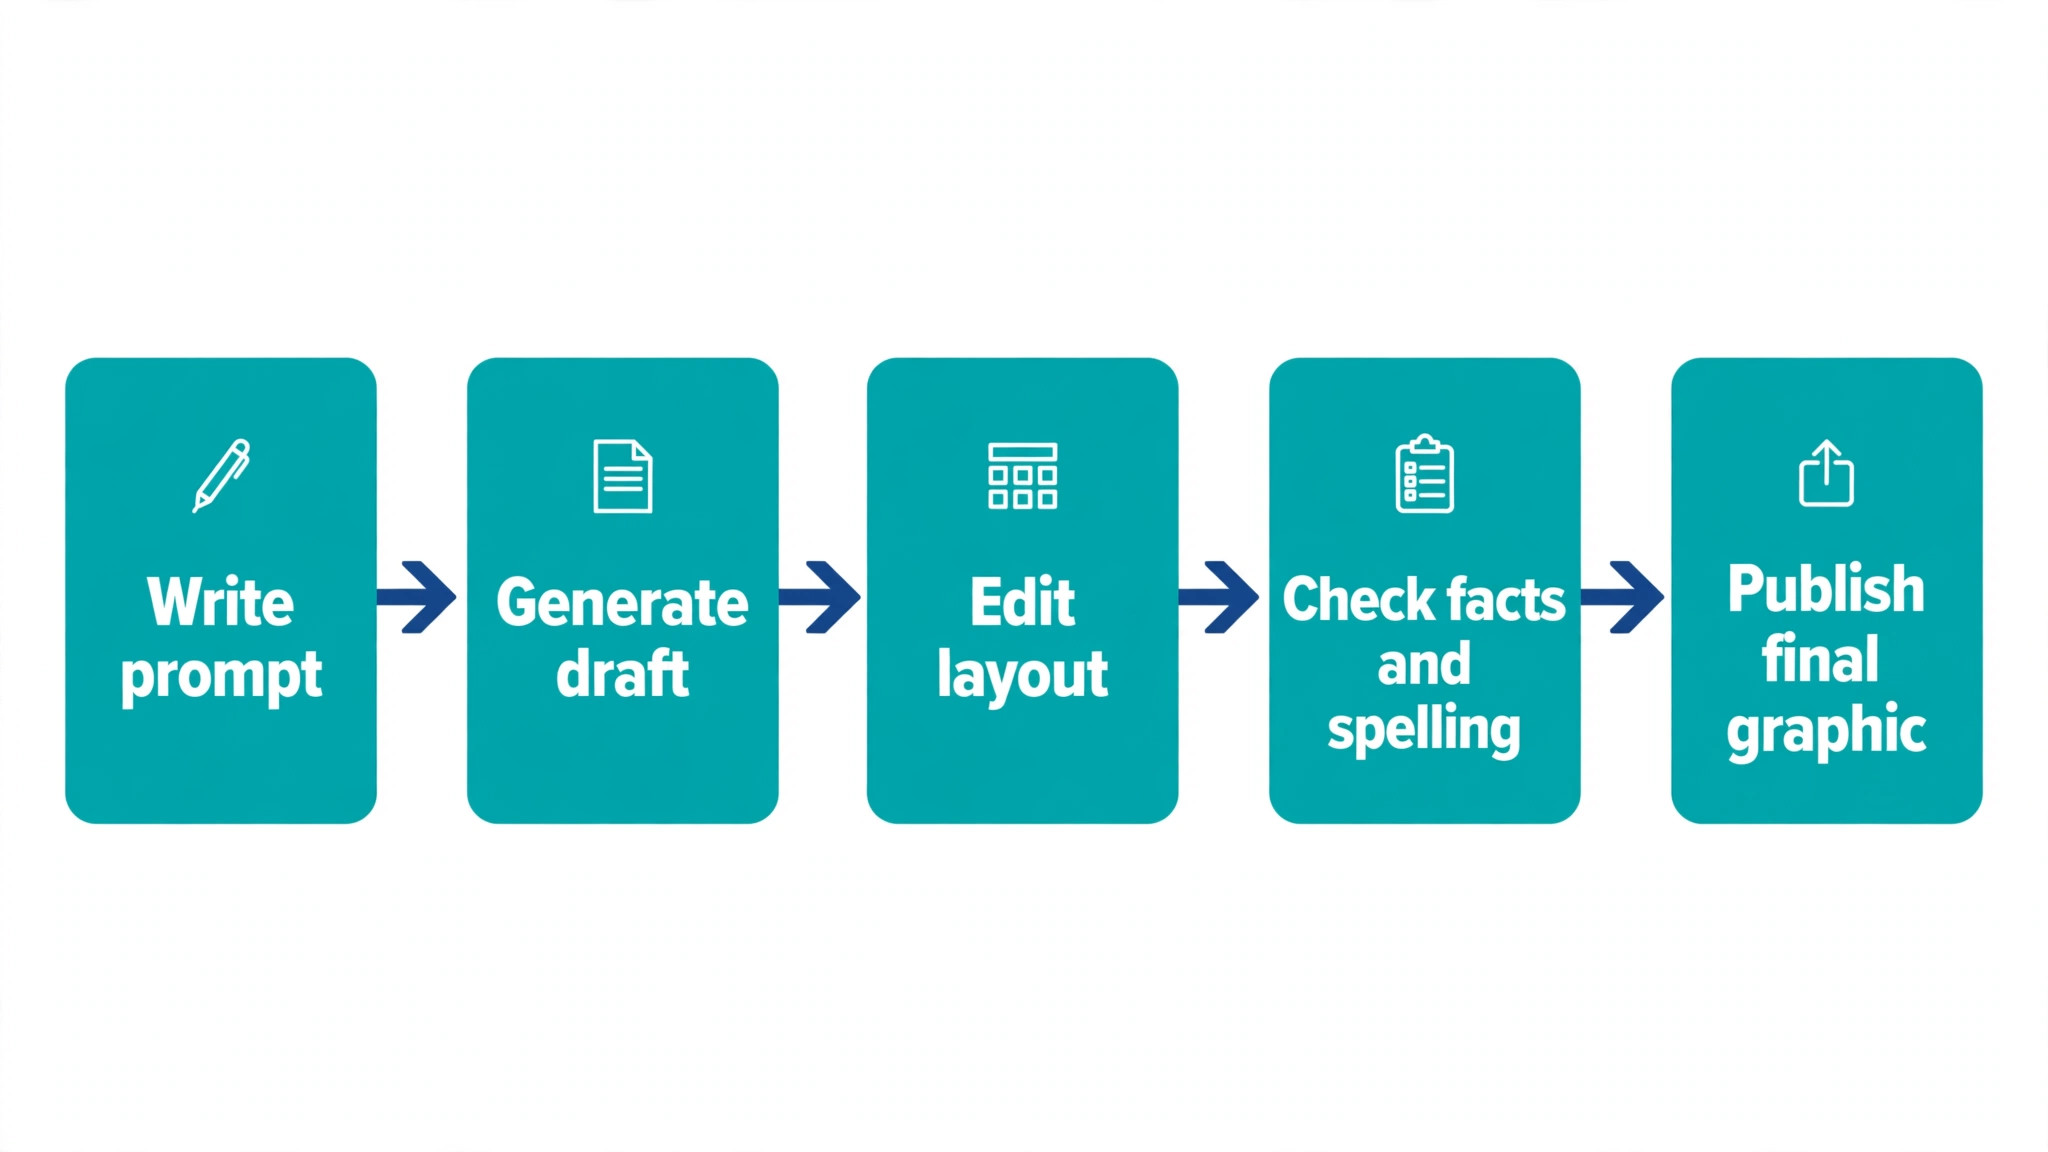
The most common mistake is cramming too much in. An infographic that tries to show ten facts shows none of them clearly. Pick three to five points, give each one space, and let the reader breathe. The second mistake is trusting AI output without checking it. AI drafts invent numbers, misread data and swap labels, so every figure in an AI generated infographic needs a human check against the source.
The third mistake is choosing chart types for looks instead of meaning. A pie chart with twelve slices is unreadable, and a 3D bar chart distorts the values it claims to show. The fourth mistake is ignoring the export. A graphic designed at web resolution will look blurry in print, and a graphic designed for print will crop badly on a phone. Design for the screen where it will be seen, and export at the right size for that screen.
The fifth mistake is forgetting the source. An infographic without a source line looks like an opinion, and readers who want to verify the numbers have nowhere to go. Add a small source note at the bottom of every data graphic, with the organisation and the year. The sixth mistake is using too many fonts and colours. Two fonts and three colours are enough for almost any infographic. More than that, and the graphic starts to look noisy instead of professional. The seventh mistake is writing paragraphs inside an infographic. Infographics are built for short labels, numbers and single sentence facts. A block of paragraph text belongs in the article next to the graphic, not inside it.
Frequently Asked Questions
Which of the best infographic makers is free?
Every tool in this list has a free plan, but the free plans differ. Canva, Piktochart, Venngage, Visme, Infogram, Adobe Express, Snappa, VistaCreate, Datawrapper, Napkin AI, Genially, Flourish and Easel.ly all let you start without paying. Canva has the most generous free plan for general use, while Piktochart gives 60 AI credits a month free. Check export limits before you commit, because several free plans add watermarks or block high resolution downloads.
Which infographic maker is best for beginners?
Canva is the easiest start for most beginners, because the templates are strong, the editor is simple and the free plan stays useful. Piktochart is the better pick for beginners who mainly make reports, because its guided layouts prevent common design mistakes. Easel.ly is the simplest of all, but its templates are plainer than the leaders.
Can I make an infographic with AI?
Yes. Piktochart, Venngage, Visme, Canva, Adobe Express and Napkin AI all generate infographic drafts from a prompt or a block of text. The drafts save time, but they are starting points, not finished work. Check every number, label and claim in an AI generated infographic against your source data before you publish it.
What size should an infographic be?
There is no single standard size. A tall infographic for a blog post is often 800 pixels wide and 2000 pixels or taller, while a social media infographic is usually square or portrait at 1080 pixels wide. Design at the size where the graphic will be viewed, keep text large enough to read on a phone, and export at twice the display size for sharp results.
Do I need a paid plan to download my infographic?
Not always, but paid plans remove the main limits. Free plans at Canva, Piktochart and Adobe Express allow downloads with some templates and features locked. Snappa limits free downloads to three a month. Venngage limits free downloads. If you publish infographics regularly, a paid plan usually pays for itself in saved time.
Which tool is best for charts and data?
Infogram and Datawrapper are the strongest for charts. Infogram wins when data updates often, because live spreadsheet sync keeps the graphic current. Datawrapper wins when precision matters most, because its chart defaults are built for newsrooms and research. Flourish is the best pick for animated data stories that readers can explore.
Final Verdict
There is no single winner, because the right tool depends on the job. Canva is the safest default for most people, Piktochart is the best choice for regular business reports, and Infogram is the pick when data updates itself. Start with the free plan of the tool that matches your main job, build one real infographic, and judge it on the finished export. The tool that gets your graphic published fastest, with numbers you trust, is the right one.
If you only remember three things from this guide, make them these. Match the tool to the job before you compare prices, because the cheapest plan is no bargain if it cannot do the work. Check every number in an AI generated draft, because a wrong figure in a published graphic is worse than no graphic at all. And design for the screen where the graphic will be seen, because an infographic that cannot be read on a phone will not be read at all. Pick one tool this week and make something real with it.